Media Consumption
FS1 vs ESPN [INFOGRAPHIC]
This inforgraphic from Sports Management Degrees illustrates the new battle between FS1 and ESPN for sports television supremacy.
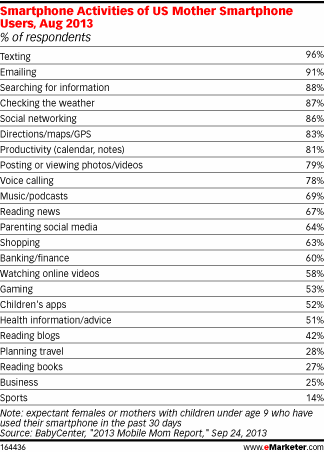
Read MoreAmerican Moms' Smart Phone Activities, August 2013 [TABLE]
Mothers’ phones are always at hand while shopping in stores, watching TV, in the car, in bed and in the kitchen.
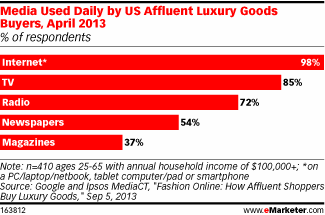
Read MoreLuxury Goods Buyers' Daily Media Consumption, April 2013 [CHART]
Among those with an annual household income of at least $100,000 who had purchased at least two luxury items in the past two years—98% went online daily.
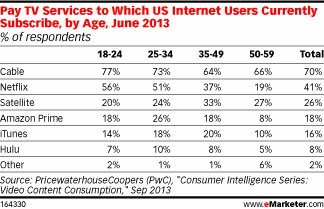
Read MorePay TV Subscribers By Channel & Age, June 2013 [TABLE]
Seventy percent of respondents shelled out for cable TV, while only 41% splurged on Netflix.
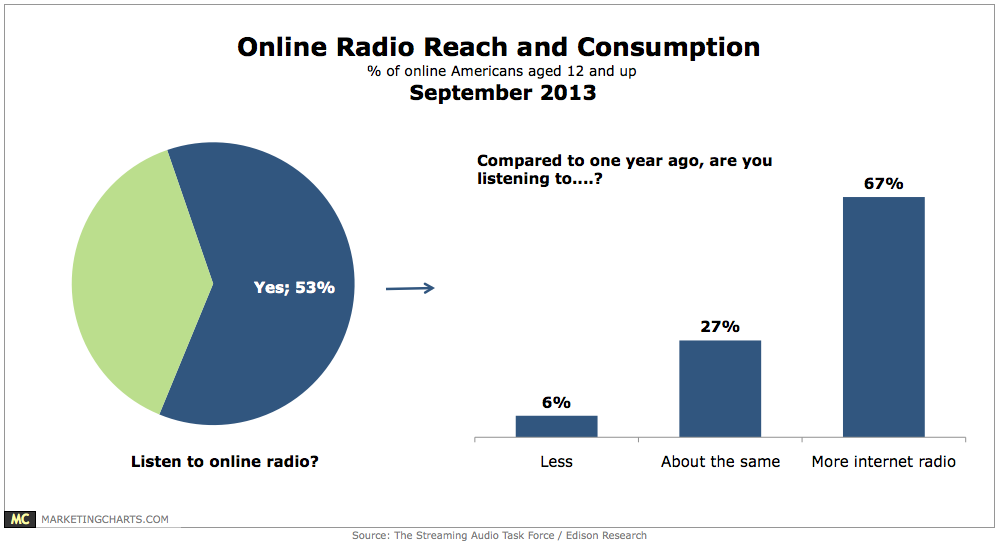
Read MoreOnline Radio Reach & Consumption, September 2013 [CHART]
53% of online Americans aged 12 and up listen to online radio, including personalized radio (39%), live streaming (27%) and on-demand music (18%) services.
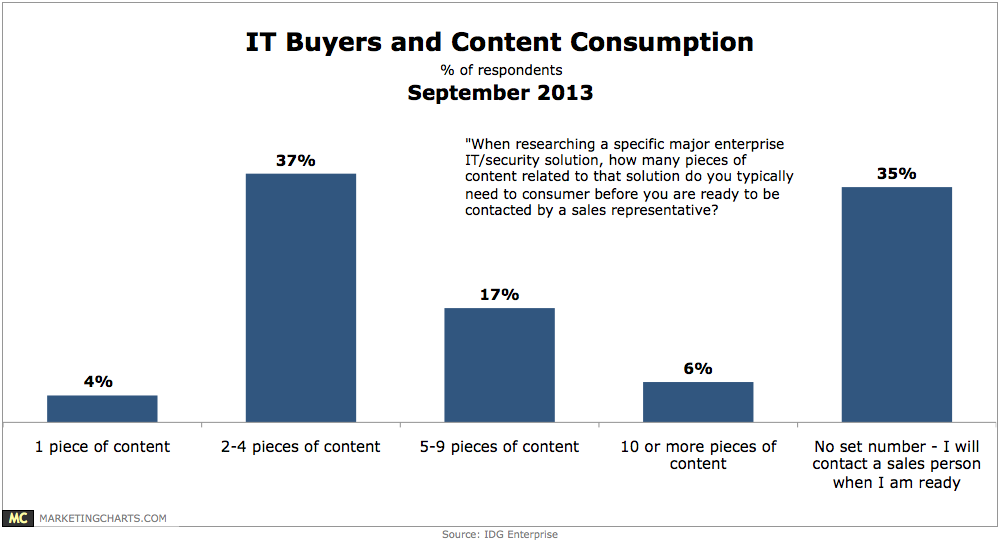
Read MoreIT Buyers' Content Consumption, September 2013 [CHART]
During the purchase process for major enterprise IT/security products and services, IT decision-makers download an average of 8 informational assets.
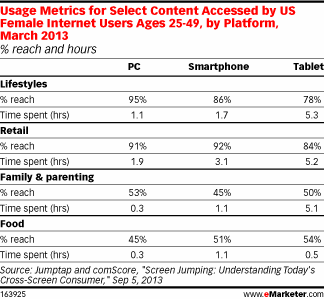
Read MoreSelect Content Types Women Consume Online By Platform, March 2013 [TABLE]
The tablet was in especially heavy rotation among women for lifestyles, retail and parenting content.
Read MoreTime Spent Online By Platform & Content Type, April 2013 [TABLE]
Plenty of online content areas were still firmly rooted in PC use, with the desktop accounting for more than 60% of time spent accessing auto, business, TV, news and sports content.
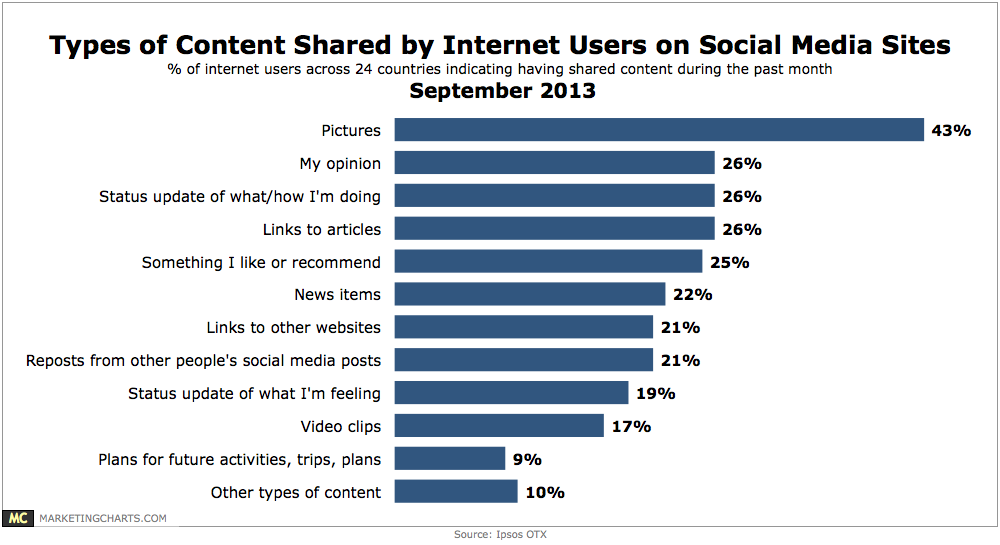
Read MoreTop Types Of Content Shared On Social Media Sites, September 2013 [CHART]
7 in 10 internet users across 24 countries say they’ve shared some type of content on social media sites in the past month.
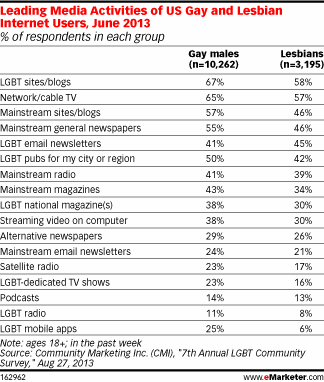
Read MoreMedia Consumption Of LGBT Americans, June 2013 [TABLE]
The most common activity among the men and women polled was visiting LGBT sites and blogs, at 67% of gays and 58% of lesbians.
Read More
