Media Consumption
Online Newspaper Audience Share By Device, August 2014 [CHART]
Mobile-only news readers represented the largest portion of the digital newspaper audience, at 38% of the total.
Read MoreVideo Viewing On Tablets, October 2014 [CHART]
Table ownership increased from 40% in 2013 to 50% in this year’s study.
Read MoreThanksgiving Social Media Chatter [INFOGRAPHIC]
This infographic from Viralheat examines more than 150,000 tweets and updates about “Thanksgiving dinner” and illustrates the social media discussion about the holiday.
Read MoreTV Average Audience Trends, Q3 2014 [CHART]
Overall TV viewership – measured by audience levels – is in fact steady.
Read MoreLive Primetime Social TV Activities, February 2014 [TABLE]
78% of US internet users accessed second screens during shows, compared with 71% who did so during ads.
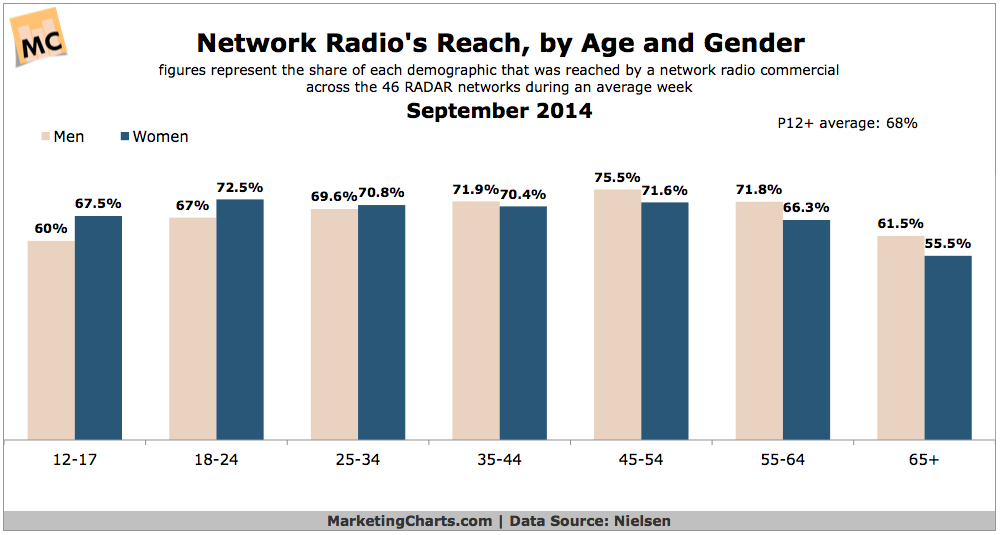
Read MoreNetwork Radio's Reach By Age & Gender, September 2014 [CHART]
Network radio reaches more than 180 million Americans aged 12 and older each week.
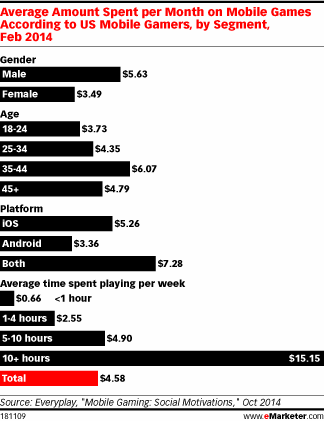
Read MoreAverage Monthly Spending On Mobile Games By Segment, February 2014 [CHART]
The smartphone gaming audience will see faster growth in 2014 and all the way through 2018.
Read MoreTrust In News Media Types By Generation, October 2014 [CHART]
American adults have the most trust in local TV news, finds Harris Interactive, with 78% having at least some trust that it will get them the news fairly and accurately.
Read MoreMobile Share of Online Video Views, 2012-2014 [CHART]
Mobile now accounts for more than one-quarter of online video views.
Read MoreFrequency With Which Millennials Use Businesses' Mobile Sites, June 2014 [CHART]
Smartphones were millennials’ device of choice for internet and app access, with nearly two-thirds (64%) of US mobile device users ages 18 to 34 citing these as their primary mobile device for logging on to the web or checking out an app.
Read More