Media Consumption
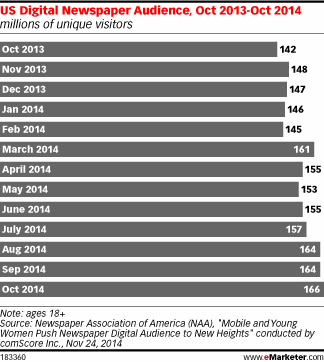
American Online Newspaper Website Visitors, 2013-2014 [CHART]
Total unique visitors to US newspaper websites rose 17% year over year to 166 million, compared with 142 million in October 2013.
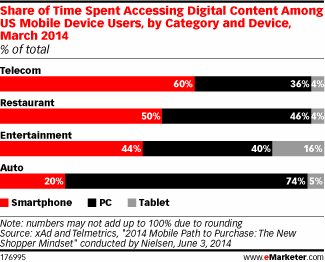
Read MoreShare Of Time Spent Consuming Content On Mobile By Category & Device, March 2014 [CHART]
Mobile remains an area of distinct opportunity for dealer innovation, especially as consumers have yet to fully integrate mobile into the buying process.
Read MoreDevice Ownership Among American Kids, October 2014 [CHART]
The majority of US children and teens under 18 have access to some sort of digital device.
Read MoreShare Of Time Spent Watching Online Video By Duration & Device, Q3 2014 [TABLE]
Mobile phones and tablets accounted for a combined 30% share of digital video views worldwide in Q3 2014, a quarter-over-quarter increase of 20%.
Read MoreHow People Discover Information Online, December 2014 [CHART]
Organic search remains the leading method by which US adults find online information and websites.
Read MorePrimary Device Used To Discuss Current Events, Q3 2014 [CHART]
Social media users are much more likely to share content via mobile devices after a major current event occurs.
Read MoreTimeframe During Which People Typically Watch TV Shows, August 2014 [CHART]
Nearly half of 18-34 year-olds watched a show after it had originally aired.
Read MoreShare of Time Spent Watching Original TV Shows By Device, October 2014 [CHART]
Millennials (18-34) report spending two-thirds of their time watching original TV series on traditional TV.
Read MoreMillennial Voters Reliance On Mobile For News, October 2014 [CHART]
Some 53% of Millennials (18-34) agree that their primary source of news and information is their smartphone or tablet.
Read MoreGrowth In Authenticated Viewing, 2013-2014 [CHART]
46% of all ad views on long-form and live content came from behind authentication walls in Q3.
Read More
