Media Consumption
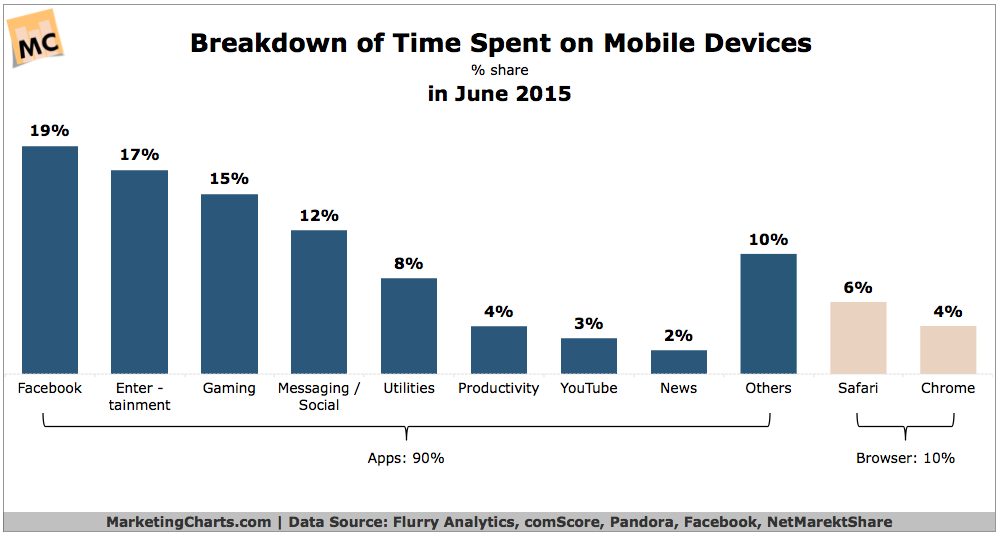
Time Spent On Mobile Devices – Apps vs Browser, June 2015 [CHART]
Apps continue to dominate US time spent with mobile, reaching 90% of mobile minutes in June 2015, up from 86% share in Q2 2014.
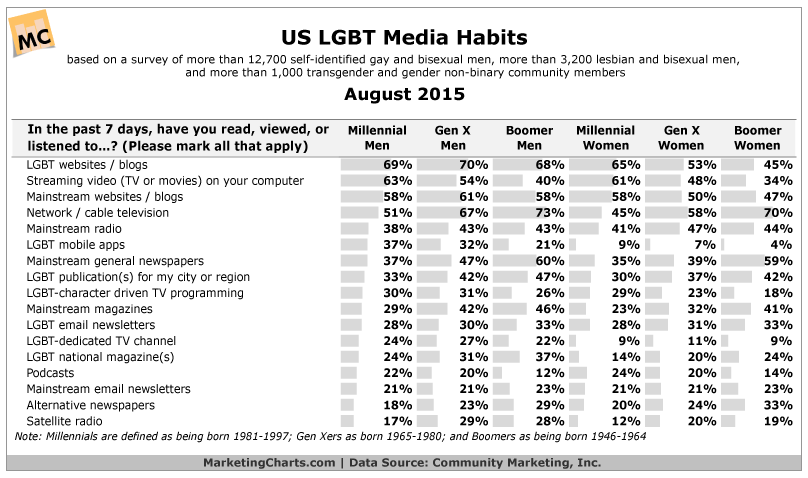
Read MoreUS LGBT Media Consumption By Generation, August 2015 [TABLE]
LGBT websites and blogs remain the most popular form of media among Millennial LGBTs.
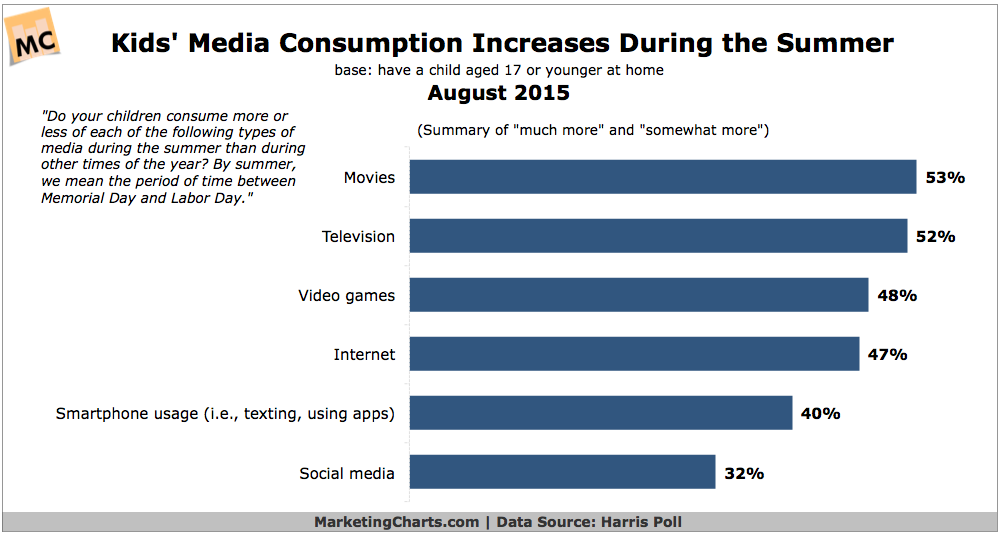
Read MoreKids' Summer Media Consumption, August 2015 [CHART]
Kids’ media consumption goes up during the summer, particularly when it comes to movies and TV.
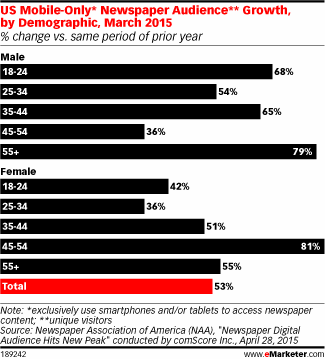
Read MoreDemographics Of US Mobile-Only Newspaper Readers, March 2015 [CHART]
Males were the driving force behind mobile-only newspaper readership gains.
Read MoreMillennials' Top Sources Of Health Information, June 2015 [CHART]
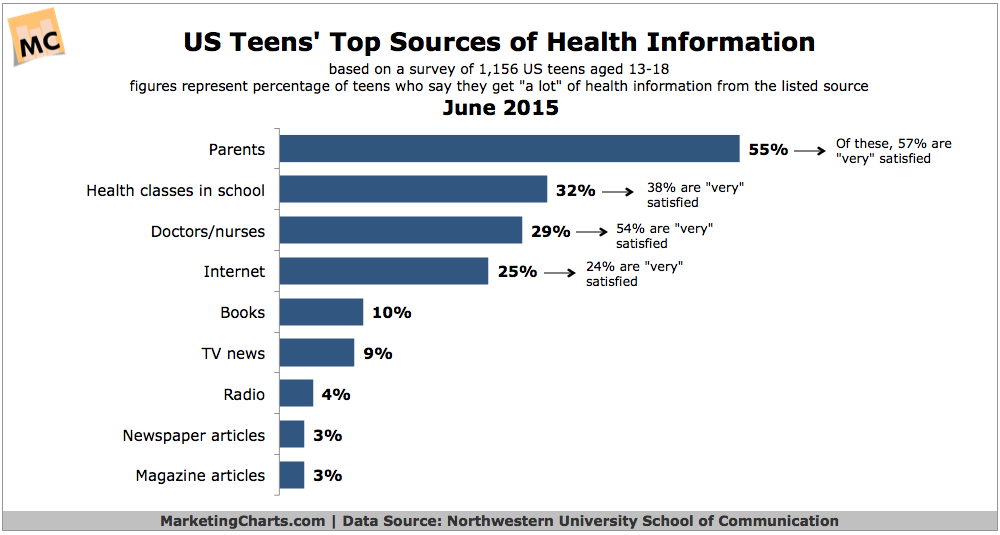
Parents are the top source of health information for teen Millennials (13-18), 55% of whom say they get ‘a lot’ of health information from them.
Read MoreGlobal Daily Media Consumption Time, 2010-2017 [CHART]
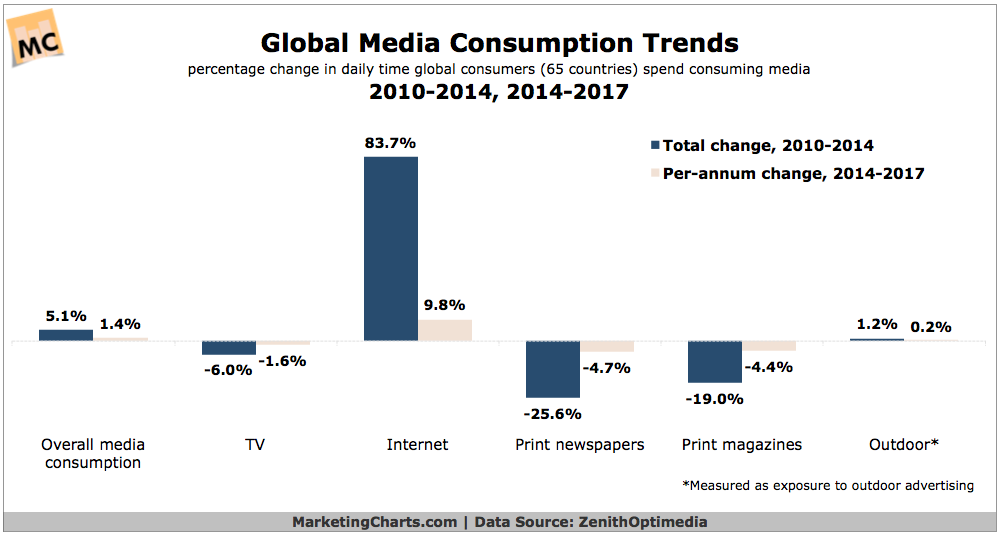
Global internet consumption grew by almost 84% between 2010 and 2014, driving overall media consumption growth of 5.1%, to 485 minutes per day,
Read MoreNews Topics Consumed Via Twitter vs Facebook [CHART]
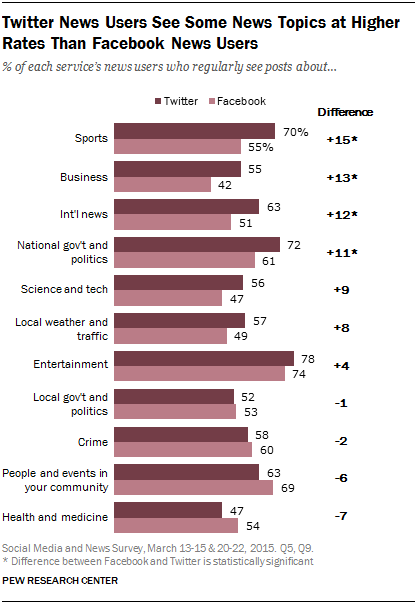
Roughly two-in-three Twitter news users (67%) report regularly seeing at least six of the 11 news topics asked about, compared with 57% of Facebook news users.
Read MoreTwitter Used For Breaking News [CHART]
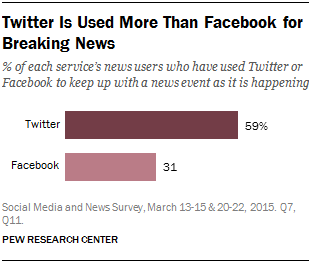
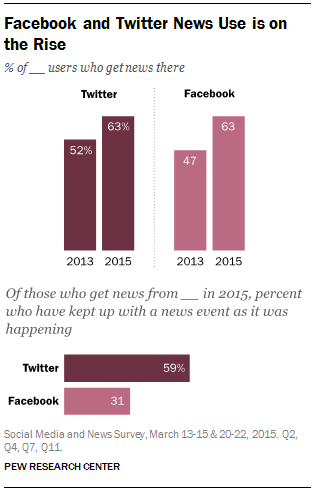
Nearly six-in-ten Twitter news users use the site to keep up with a news event as it is happening.
Read MoreTwitter vs. Facebook As A News Source [CHART]
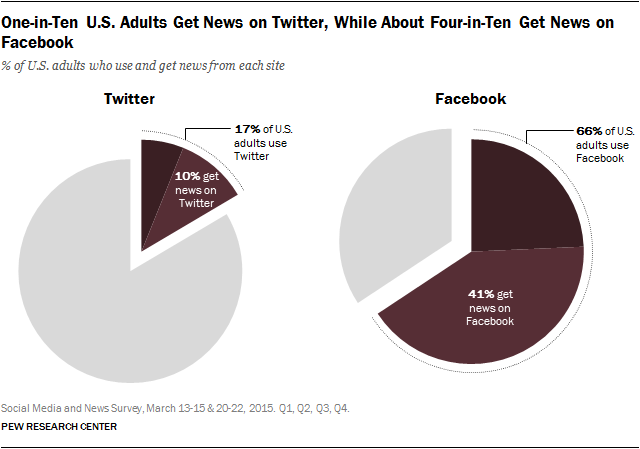
As of early 2015, 63% of Facebook and Twitter users get news on their respective sites.
Read MoreFacebook & Twitter As News Sources, 2113 & 2015 [CHART]
The share of Americans for whom Twitter and Facebook serve as a source of news is continuing to rise.
Read More