Media Consumption
Millennials Don't Care About Privacy [CHART]
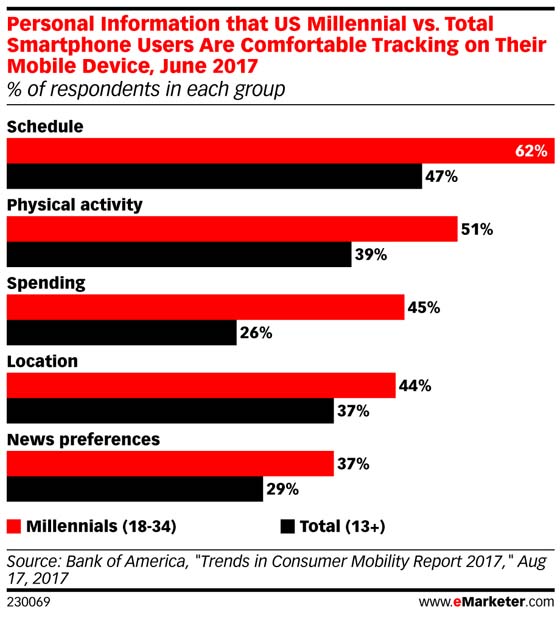
Among US smartphone users, Millennials were more amenable to the idea that their smartphones were tracking everything from physical activity to news preferences.
Read MoreMillennials' Frequency Of Podcast Listening [CHART]
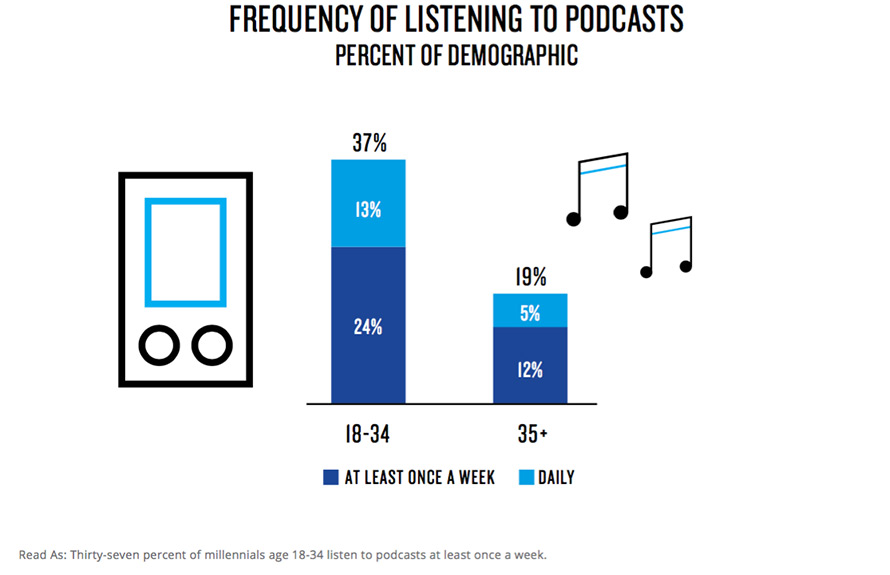
Millennials aged 18-34 used their smartphone to access both apps and the web for 78 billion minutes in the average week.
Read MoreUS News Consumption Sources, 2012-2017 [CHART]
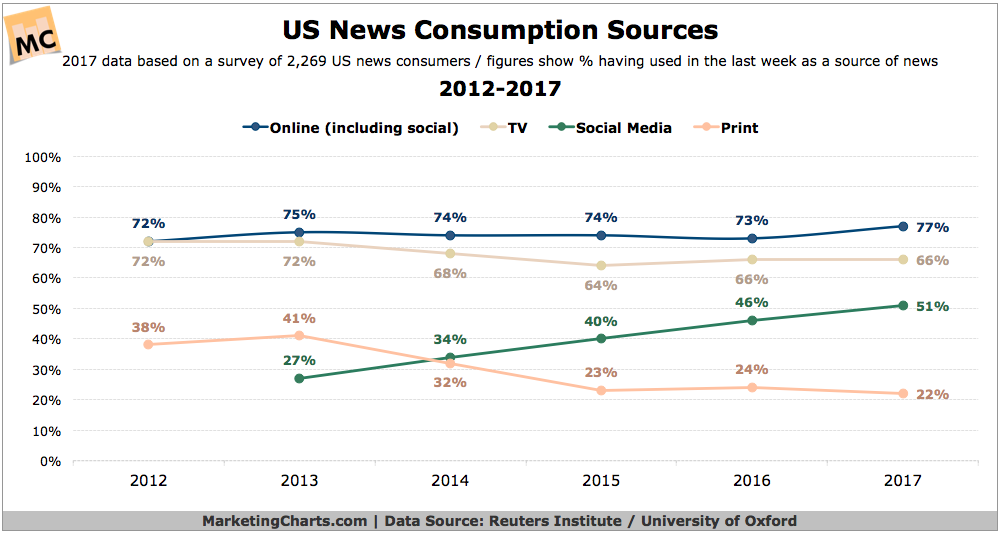
This year for the first time a majority (51%) of Americans surveyed reported using social media as a source of news during the prior week.
Read MoreTop Morning Sources Of News On Mobile [CHART]
Many people look to social media for their news consumption. This chart shows where.
Read MoreTop Referrers Of Mobile Traffic (After Facebook & Google) [CHART]
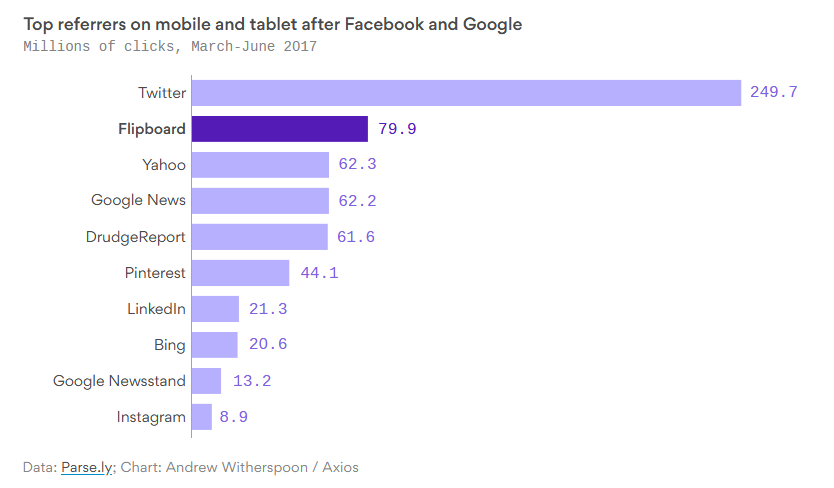
Flipboard is becoming one of the biggest drivers of traffic to news stories on mobile.
Read MoreTop Reasons To Use Smart Speakers [CHART]
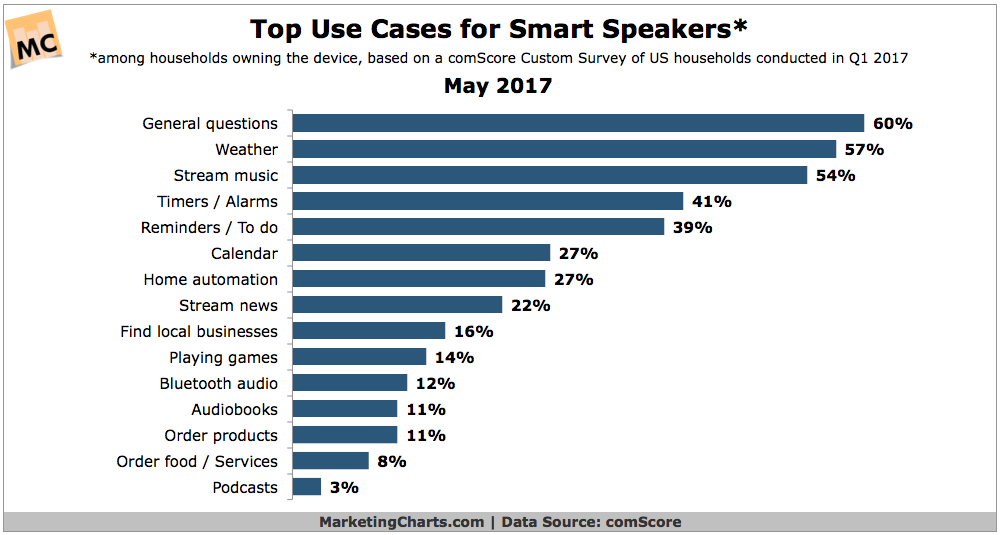
For the time being, the most common use cases for Smart Speakers among households owning these devices are general questions, weather and streaming music.
Read MoreBudgeting For Digital Marketing Trends [INFOGRAPHIC]
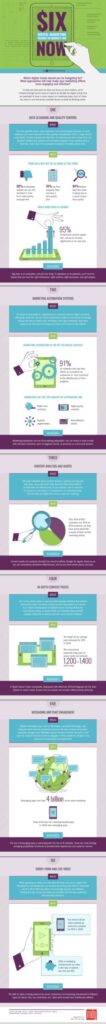
This infographic by MGD Advertising identifies the six trends that are the most important for digital marketers to budget for.
Read MoreTraditional TV Viewing, 2011-2016 [CHART]
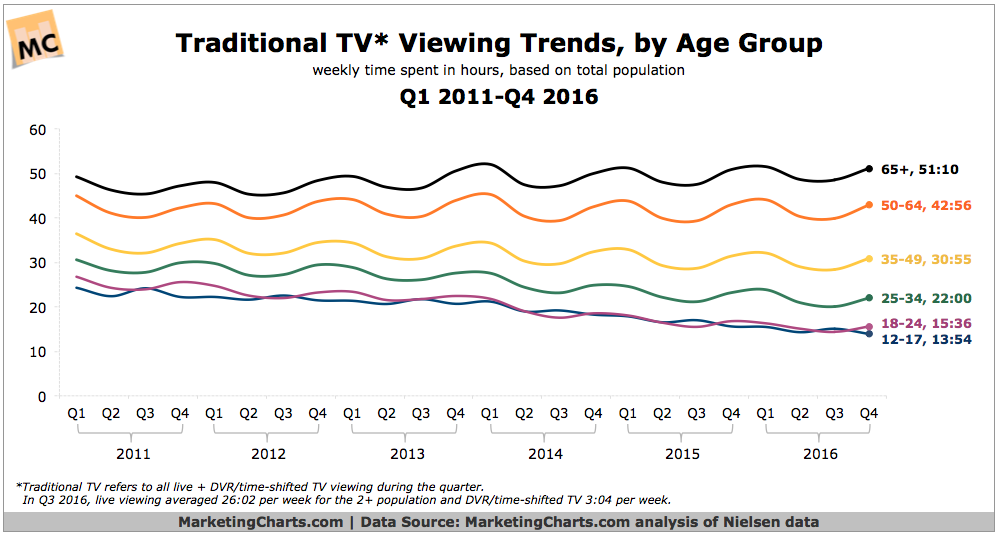
Between 2011 and 2016, Q4 traditional TV viewing by 18-24-year-olds dropped by almost 10 hours a week, or by roughly 1 hour and 25 minutes per day.
Read MoreTechnographics Of American Mothers [CHART]
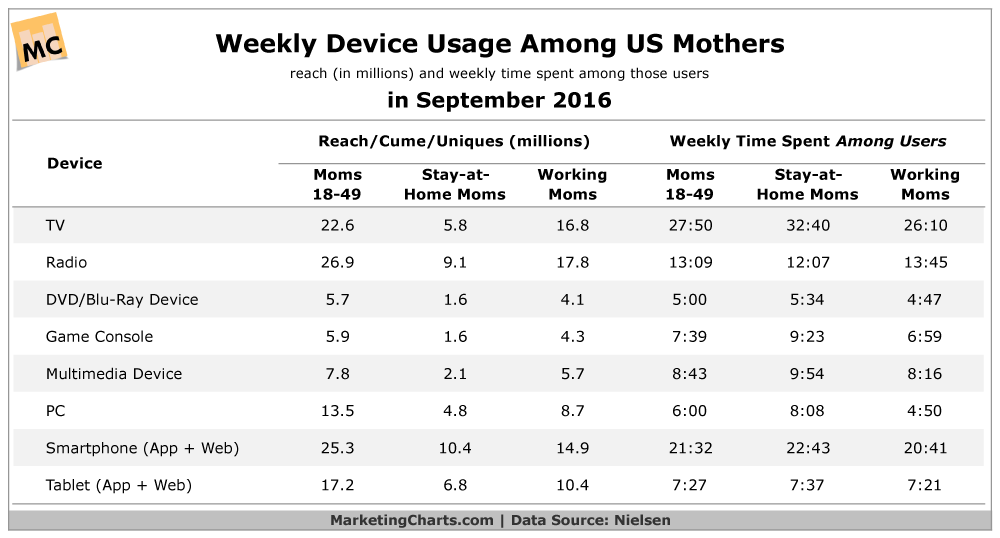
Across 10 technologies, ownership levels are universally greater among working than stay-at-home moms.
Read MoreAverage Time Spent Per Day With Major Media [CHART]
Thanks to multitasking, US adults’ average daily time spent with major media will slightly exceed 12 hours this year.
Read More