Marketing Budgets
2014 Marketing Budget Plans By Channel [CHART]
9 in 10 business leaders plan to either increase (46%) or maintain (47%) their marketing budgets in 2014.
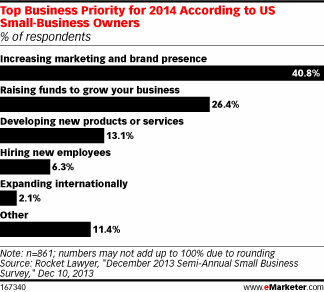
Read MoreSmall Business Owners' Top Priorities For 2014 [CHART]
About 41% of small-business owners said increasing marketing was a top business priority for next year.
Read MoreWeb Designers vs Web Developers [INFOGRAPHIC]
This infographic by Webydo illustrates the state of the web design industry with a particular focus on the needs of web designers vs web developers.
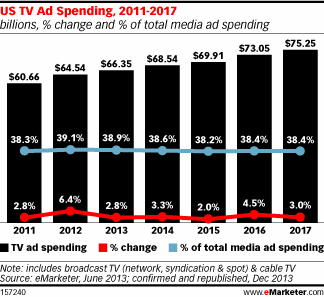
Read MoreUS TV Ad Spending, 2011-2017 [CHART]
TV advertising expenditures are set to climb from $66.35 billion to $75.25 billion between 2013 and 2017.
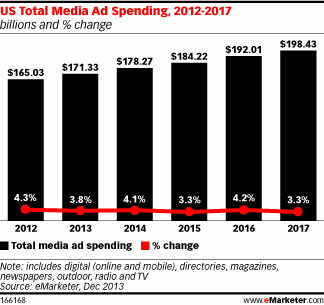
Read MoreUS Total Media Ad Spending, 2011-2017 [CHART]
US total media ad spending will reach $171.33 billion in 2013, up 3.8%, or more than $6 billion, from 2012.
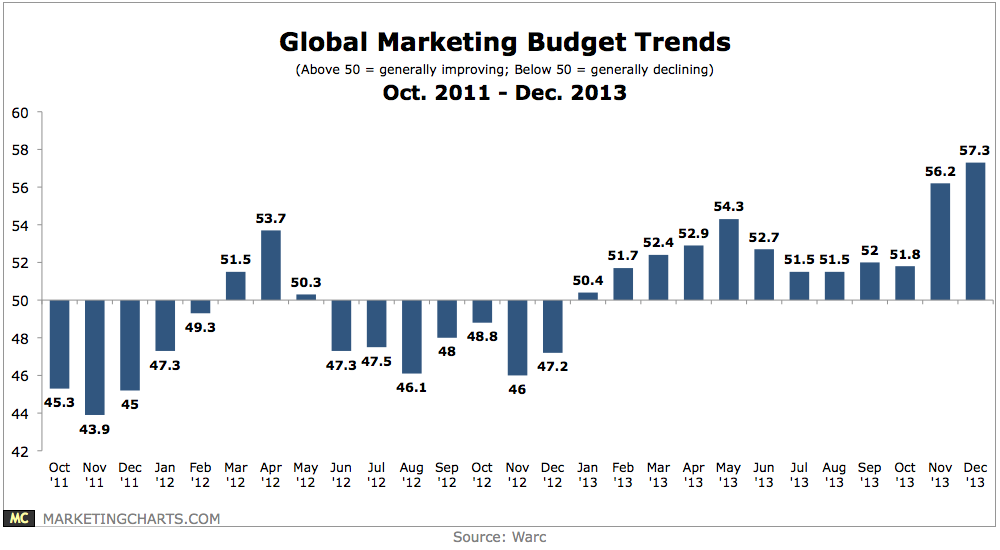
Read MoreGlobal Marketing Budget Trends, October 2011 – December 2013 [CHART]
Global marketers are as optimistic regarding their budgets as they’ve been in at least a couple of years.
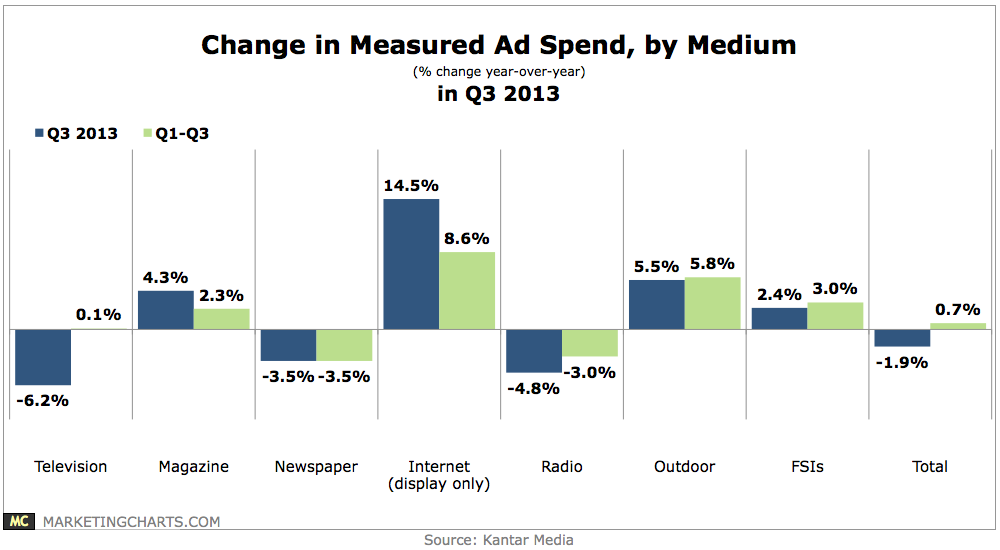
Read MoreChange In Ad Spend By Medium, Q3 2013 [CHART]
Total ad expenditures in Q3 were down 1.9% year-over-year, an unsurprising result given last year’s outlays on the Summer Olympics and political campaigns.
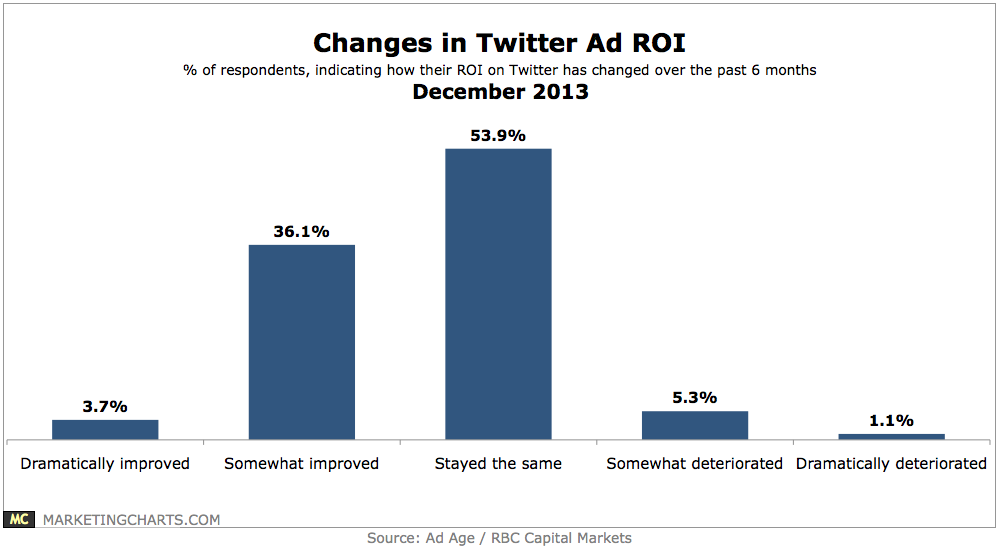
Read MoreChanges In Twitter Ad ROI, December 2013 [CHART]
Roughly 6 in 10 marketers advertising on Twitter expect their Twitter ad budgets to increase either significantly (12.1%) or modestly (47.1%) over the next year.
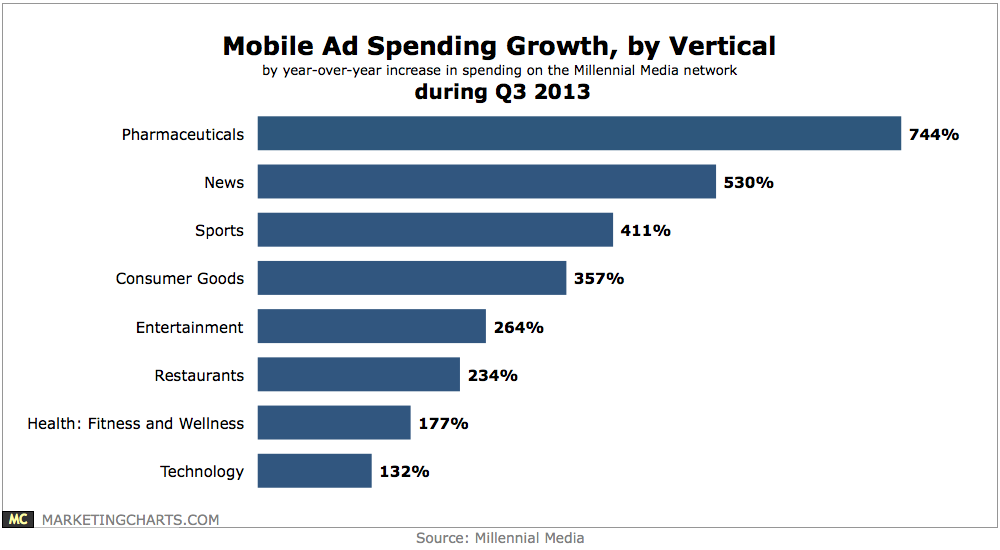
Read MoreMobile Ad Spending Growth By Vertical, Q3 2013 [CHART]
The pharmaceutical vertical leading the pack by virtue of an impressive 744% year-over-year increase in spending.
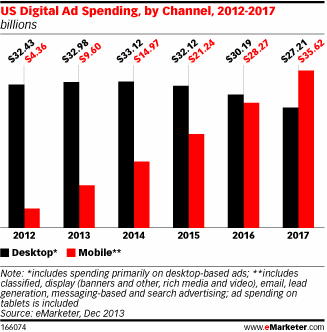
Read MoreUS Online Ad Spending By Channel, 2012-2017 [CHART]
US digital ad spending, including paid media spending on ads appearing on all digital devices, will increase 15.72% this year to $42.58 billion.
Read More