International
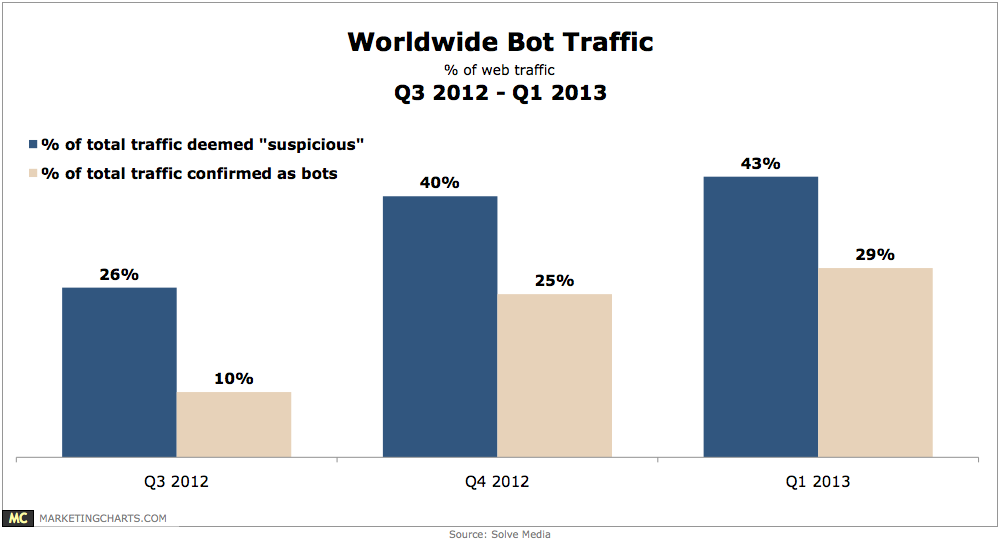
Global Bot Traffic, Q3 2012 – Q1 2013 [CHART]
Bot traffic is up again in Q1, even after a spike in Q4.
Read MoreGlobal Ad Spending Growth By Media, 2012 [CHART]
TV, which commands the lion’s share of global ad budgets, saw a 4.3% increase in expenditures for the year, reaching $350 billion.
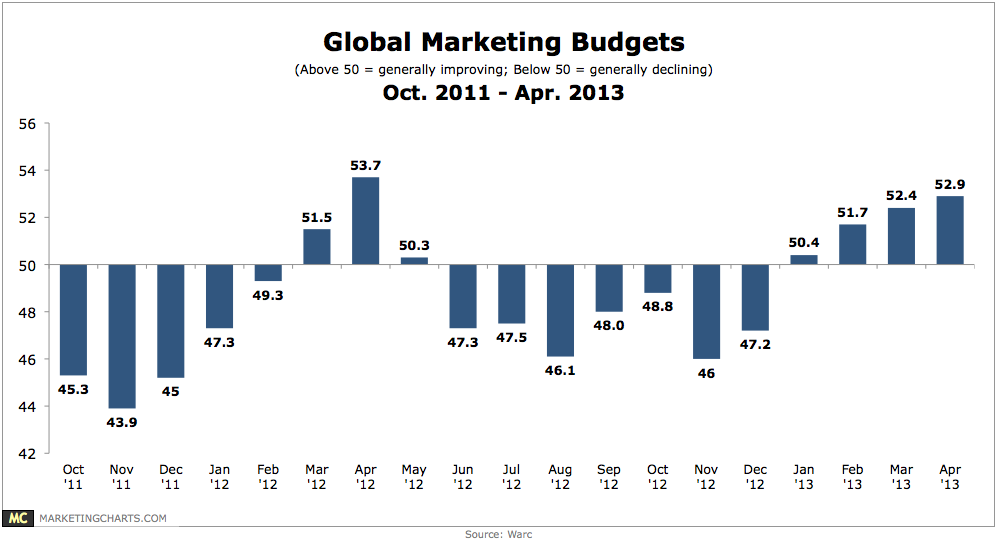
Read MoreGlobal Marketing Budgets, October 2011 – April 2013 [CHART]
Marketing budget conditions improved again this month.
Read MoreGlobal mCommerce Interest By Gender, April 2013 [CHART]
Men appear to be more interested in using their mobile phones than women.
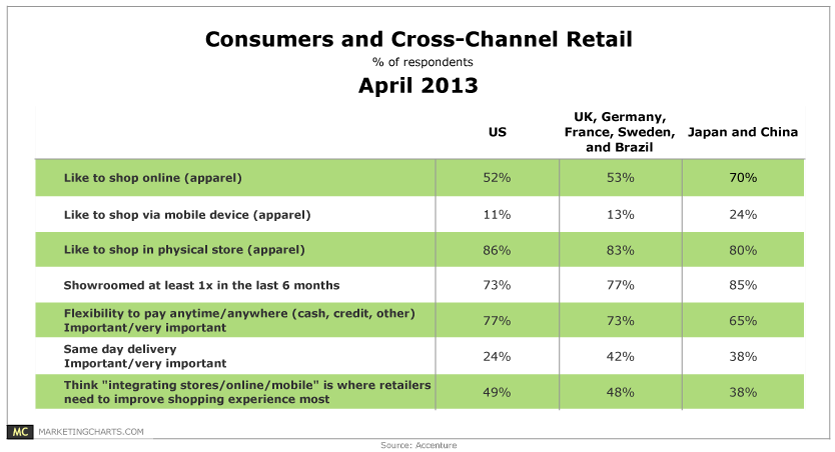
Read MoreConsumers & Cross-Channel Retail, April 2013 [TABLE]
49% of US consumers believe the best thing that retailers can do to improve the shopping experience is to better integrate in-store, online and mobile shopping channels.
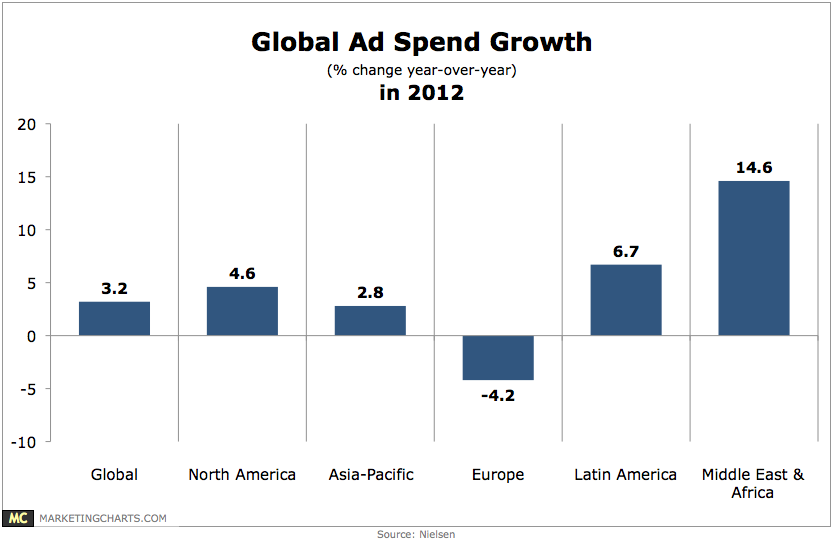
Read MoreGlobal Ad Spending Growth In 2012 [CHART]
Worldwide advertising spending grew by 3.2% year-over-year in 2012 to reach $557 billion.
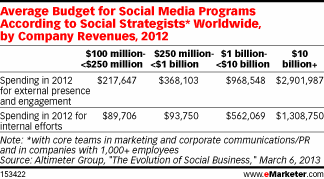
Read MoreAverage Social Media Marketing Budgets Worldwide, 2012 [TABLE]
Companies dedicated between 20% and 37% of their total social media development spending to “internal social media” in 2012.
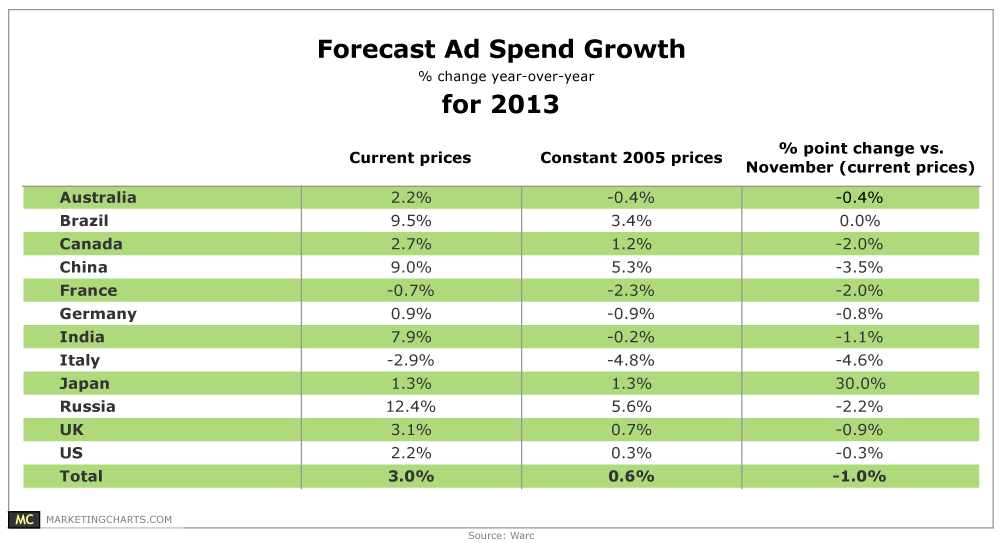
Read MoreGlobal Ad Spending Growth Forecast For 2013 By Country [TABLE]
Global advertising spend (based on trends in 12 major markets) will increase by 3% this year and 5.4% next year.
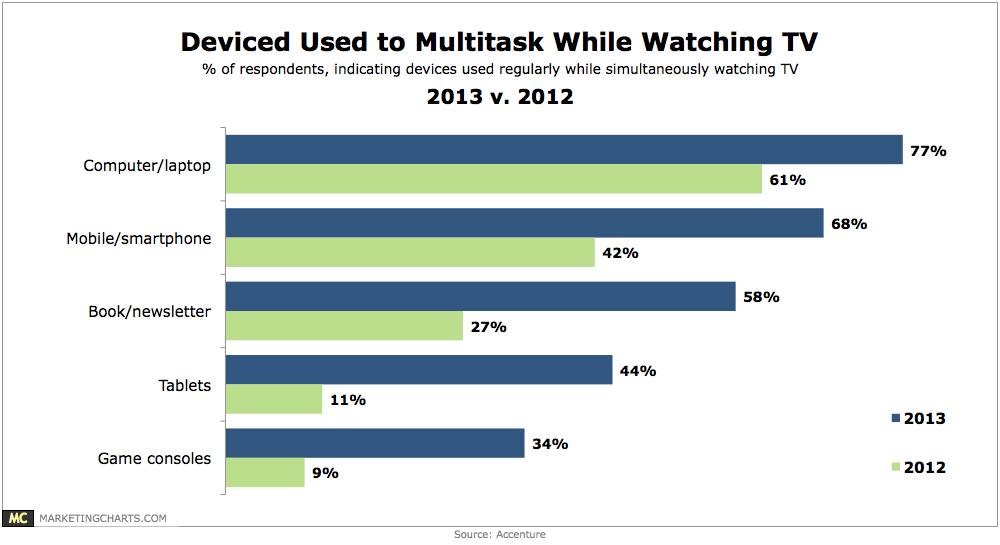
Read MoreDevices Use For Multitainment, 2012 vs 2013 [CHART]
Regular use of tablets while watching TV (on a TV set) has soared from 11% in 2012 to 44% this year.
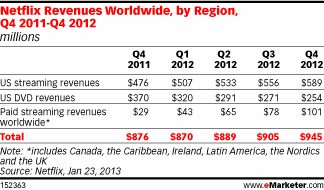
Read MoreGlobal Netflix Revenues By Region, Q4 2011-Q4 2012 [TABLE]
Netflix reported US streaming revenues of $2.19 billion for 2012, with moderate growth from quarter to quarter.
Read More