International
State of Data Quality, February 2014 [CHART]
On average, American companies believe that 25% of their data is inaccurate.
Read MoreGlobal Traveler, 2014 [INFOGRAPHIC]
This infographic from LastRoom paints a picture of the behavior of the global traveler of 2014.
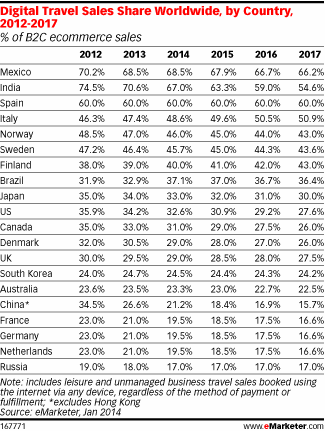
Read MoreGlobal Digital Travel Sales Share By Country, 2012-2017 [TABLE]
Only four markets will see travel increase its share of B2C eCommerce between 2012 and 2017: Italy, Brazil, Finland and South Korea.
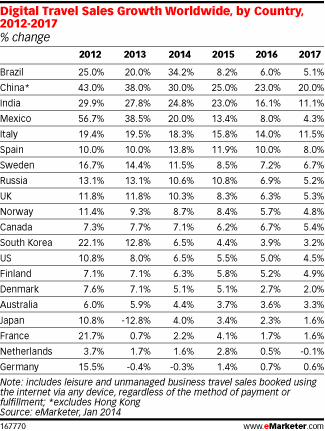
Read MoreGlobal Digital Travel Sales By Country, 2012-2017 [TABLE]
Consumers across the world are becoming more comfortable making purchases on the internet, and digital travel sales are beginning to mature on a global basis.
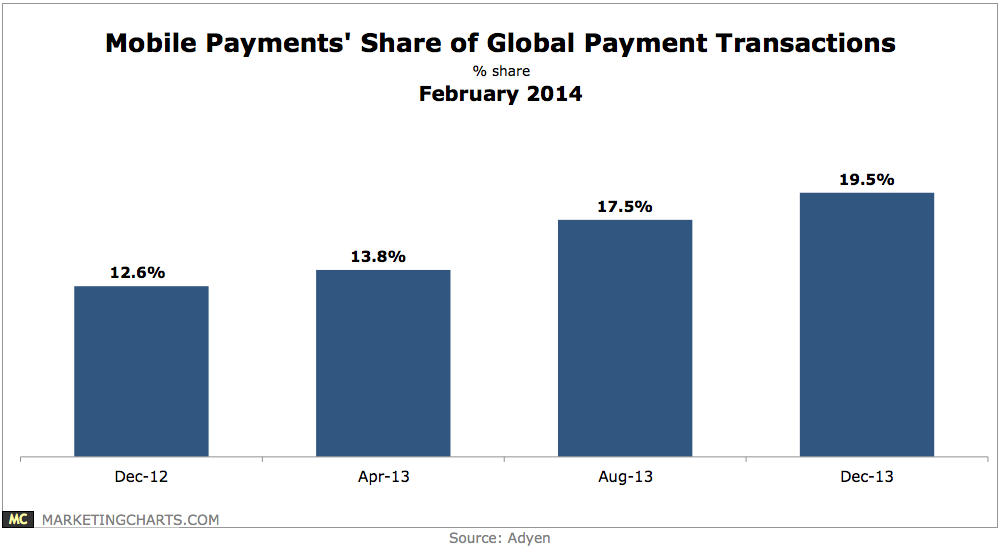
Read MoreMobile Payments' Share Of Global Payment Transactions, February 2014 [CHART]
The share of payment transactions taking place on a smartphone or tablet grew to 19.5% in December 2013, rising from 17.5% in August, and up 55% year-over-year from 12.6% the prior December.
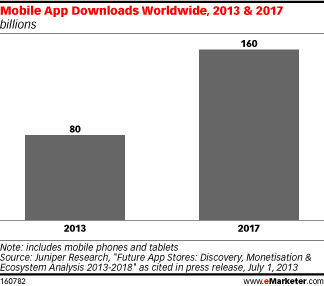
Read MoreGlobal Mobile App Downloads, 2013 & 2017 [CHART]
Portio Research estimated the number of annual downloads would top 200 billion in 2017—two-and-a-half times 2013’s 82 billion.
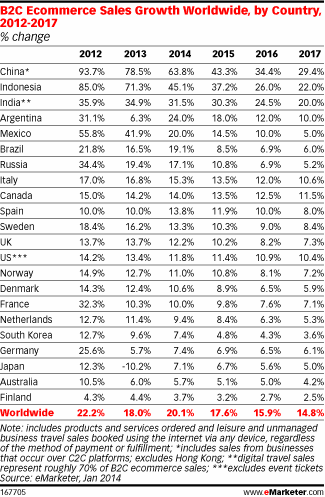
Read MoreGlobal B2C eCommerce Growth By Country, 2012-2017 [TABLE]
China will take in more than six of every 10 dollars spent on eCommerce in Asia-Pacific this year and nearly three-quarters of regional spending by 2017.
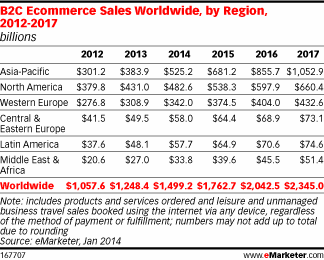
Read MoreGlobal B2C eCommerce Sales By Region, 2012-2017 [TABLE]
In 2014, for the first time, consumers in Asia-Pacific will spend more on eCommerce purchases than those in North America.
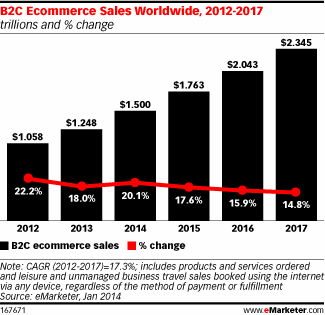
Read MoreGlobal B2C eCommerce Sales, 2012-2017 [CHART]
Worldwide B2C eCommerce sales will increase by 20.1% this year to reach $1.500 trillion.
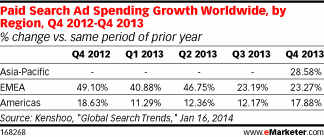
Read MoreGlobal Search Ad Spending Growth, Q4 2012-Q4 2013 [TABLE]
The growth rate for search ad spending in Asia-Pacific hit 28.58% in Q4 2013, making it the leader among all regions.
Read More
