International
Online Display Ad Benchmarks By Region in 2013 [CHART]
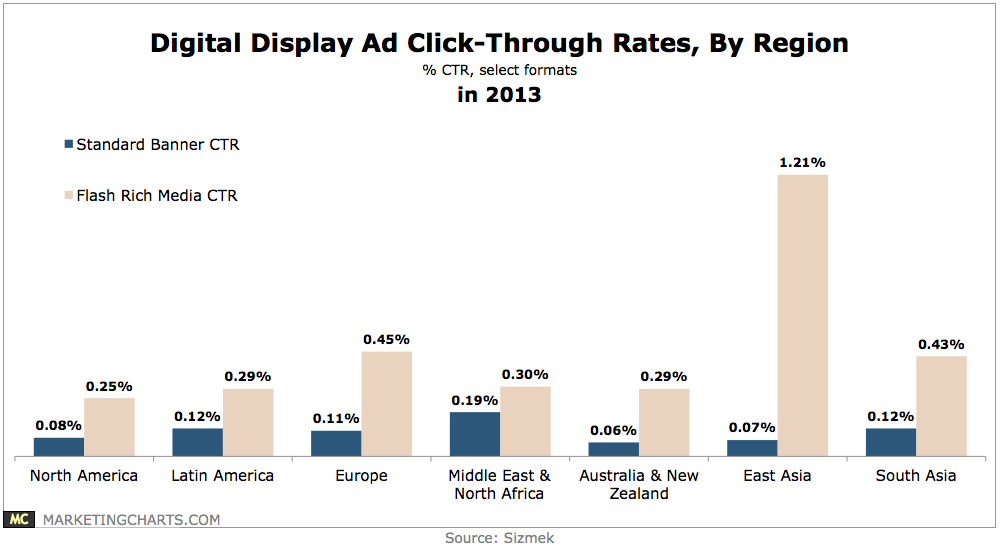
In North America, the average click-through rate (CTR) for standard banners slipped from 0.1% to 0.08%, while flash rich media CTRs jumped from 0.14% to 0.25%.
Read MoreSmart Phone User Penetration In Western Europe By Country, 2012-2017 [TABLE]
The number of people in Italy owning at least one smartphone will reach an estimated 25.8 million this year.
Read MoreItalian Mobile Social Media Activities, November 2013 [CHART]
eMarketer estimates that 41.8% of the Italian population will have a smartphone in 2014—well below the regional average of 47.0%—and a similar gap will persist through 2017.
Read MoreItalian Multitainment Activities, November 2013 [CHART]
Almost half (46.3%) of Italian smart phone users who used their phone for any activity related to a TV program said they visited social networks.
Read MoreUK Companies That Have Adopted Big Data, 2012-2017 [CHART]
The proportion of UK firms with big data initiatives was expected to reach 29% in 2017, compared with 20% in 2013.
Read MoreNorth American Mobile Location-Based Services Revenues, 2013 & 2018 [CHART]
60% of mobile users now accessing LBS at least monthly.
Read MoreMobile Germans Who Pay Favorable Attention To Ads By Device, March 2014 [TABLE]
In Germany only 8% to 12% said they favored ads on a smartphone, laptop or tablet but at least 40% said they paid attention to ads on those devices.
Read MoreMobile Spanish Users Who Pay Favorable Attention To Ads By Device, March 2014 [TABLE]
Nearly one-third (31%) of Spanish mobile users said they liked ads on TV, with the percentages for laptops and smartphones at 19% and 14%, respectively.
Read MoreFrench Mobile Users Who Pay Favorable Attention To Ads By Device, March 2014 [TABLE]
In France, 23% said they reacted favorably to ads on TV, while only 10% were well disposed to ads on their smartphones, and 9% welcomed ads on their laptops.
Read MoreInteractive Video Completion Rates Worldwide By Region, 2013 [TABLE]
While clickthrough rates for such ads in 2013 were much lower than those for HTML5 polite video and in-stream video, at 0.17%, 0.39% and 0.60%, respectively, interactive videos did just what they set out to do: Engage those who did view them.
Read More