Household Income
Generation X Household Budget [TABLE]
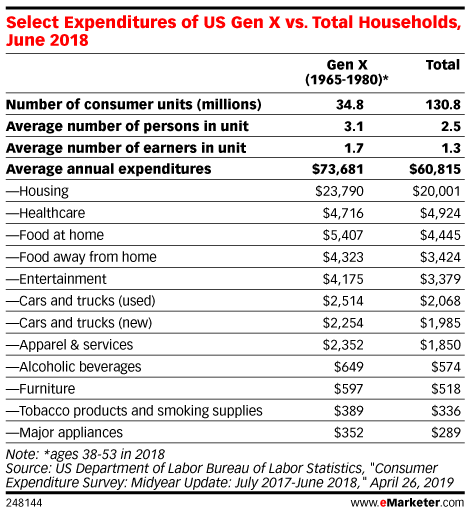
At 65 million strong, Gen X—those born between 1965 and 1980 per our definition—is smaller in size than the boomer and millennial generations, but their average pretax household income is about $101,000 annually, nearly $25,000 more than the average for all US households.
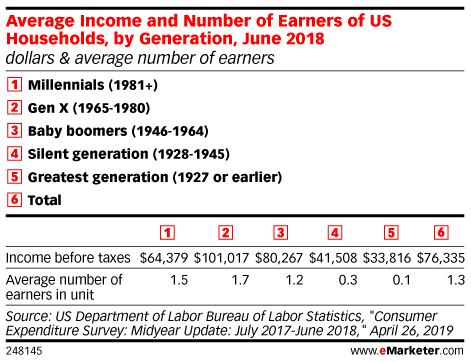
Read MoreAverage Household Income By Generation [TABLE]
The ‘forgotten’ Generation X makes and spends more than other generations, but they’re also financially stressed.
Read MoreDigital Nevers [CHART]
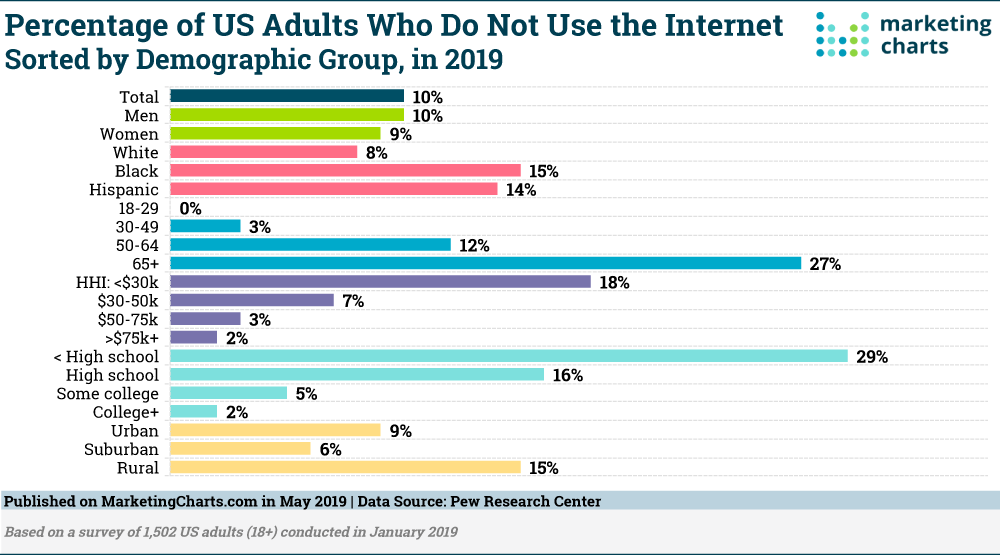
The proportion of US adults who do not use the internet continues its slow decline, per data from the Pew Research Center, as the percentage of the US adult population who do not use the internet has more than halved in fewer than 10 years.
Read MoreTikTok US Users By Age & Income [CHART]
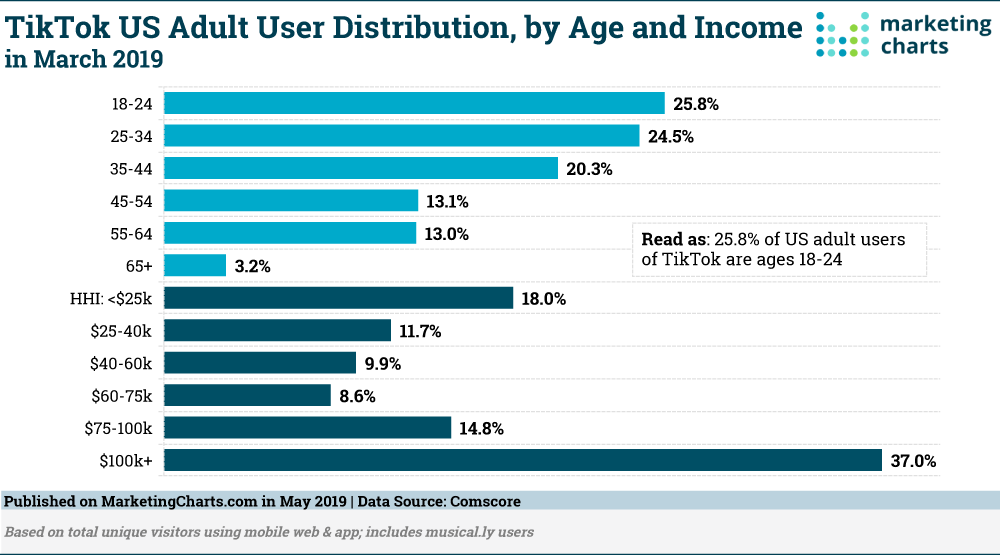
Who is downloading and using TikTok? Not surprisingly, data from March 2019 shows that the age group with the largest number of unique visitors is 18-24-year-olds (3.7 million), which accounts for just over one-quarter (25.8%) of the total US adult visitors.
Read MoreInstagram Statistics [INFOGRAPHIC]

This infographic from Make A Video Hub illustrates Instagram’s history and growth, demographics and usage statistics.
Read MoreOffline Americans By Demographic [CHART]
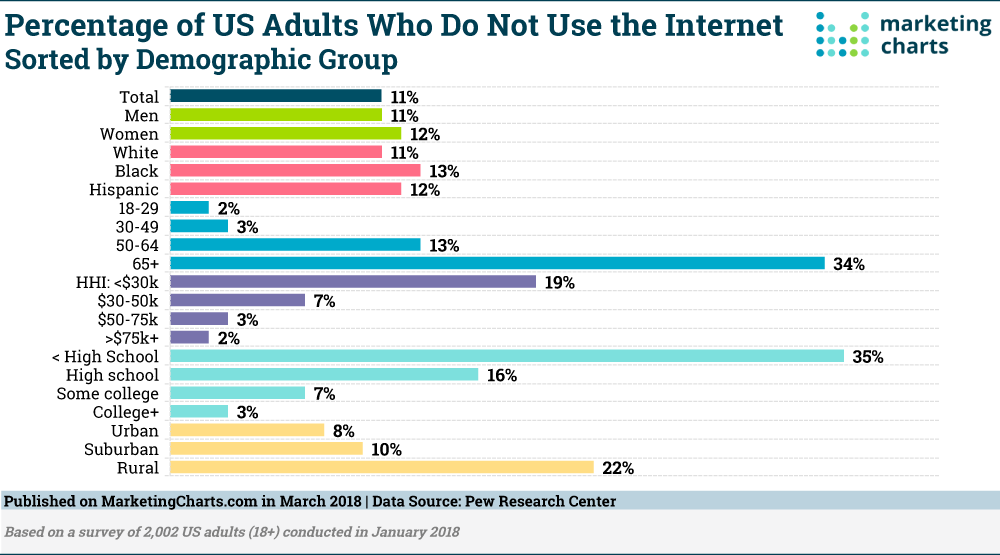
A declining yet substantial proportion of the US adult population does not use the internet. In fact, 11% of US adults do not go online, with that figure down from 15% in a previous analysis released 5 years ago.
Read MoreHousehold Income By Generation [TABLE]
According to the US Department of Labor Bureau of Labor Statistics, millennial-headed households earned real money last year, averaging $65,373 (vs. $74,664 for total households)—though this leaves out the many millennials who have yet to establish households.
Read MoreConsumer Attitudes Toward Facial Recognition By Demographic [TABLE]
There’s no denying that smartphones with biometrics will soon be the norm. But consumers are somewhat split when it comes to mobile devices with facial recognition capability,
Read MoreAffluent Americans By Generation [CHART]
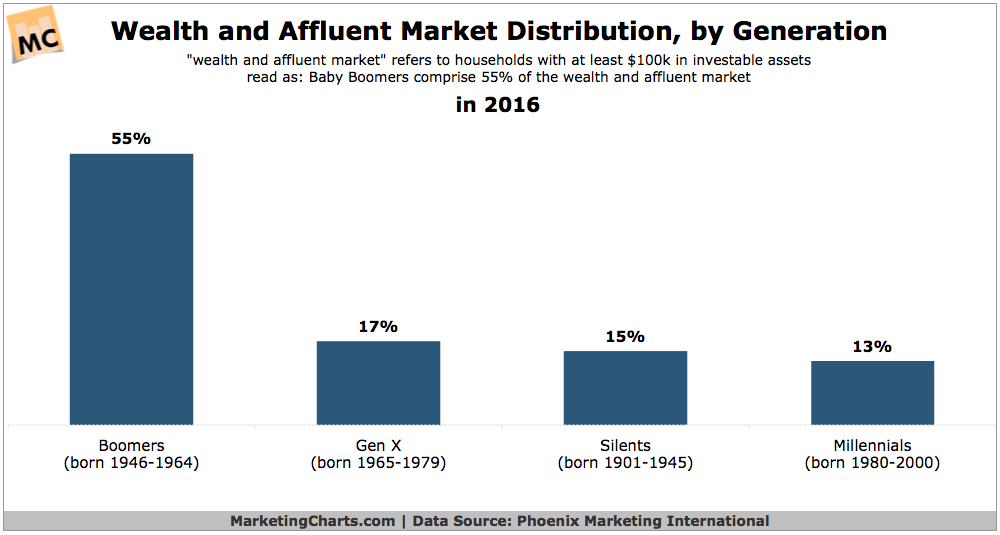
Today’s marketers very much hold a focus on Millennials – and even Gen Z. But when it comes to wealth in the US, younger generations distantly trail their older counterparts, despite some gains.
Read MoreDemographics Of Online Grocery Shoppers [CHART]
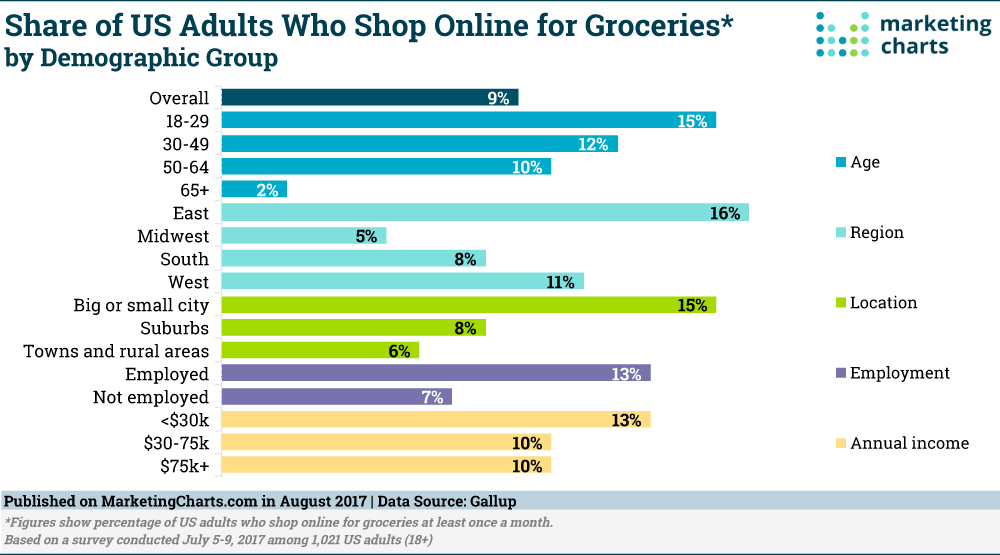
Online grocery shopping is still nascent, but it’s responsible for 80% of grocery dollar sales growth and is making inroads with certain segments of the population.
Read More