Generations
Wanna Reach Gen Z? Use Mobile Video [CHART]
Of the 1,000 US internet users surveyed, more than half (56%) of Gen Zers, ages 16 to 24, said they had increased their use of Snapchat in the past year, and another 55% of respondents said they are using Instagram more.
Read MoreEmail Personalization [INFOGRAPHIC]
This infographic from Active Trail illustrates 13 email personalization statistics to help make your case.
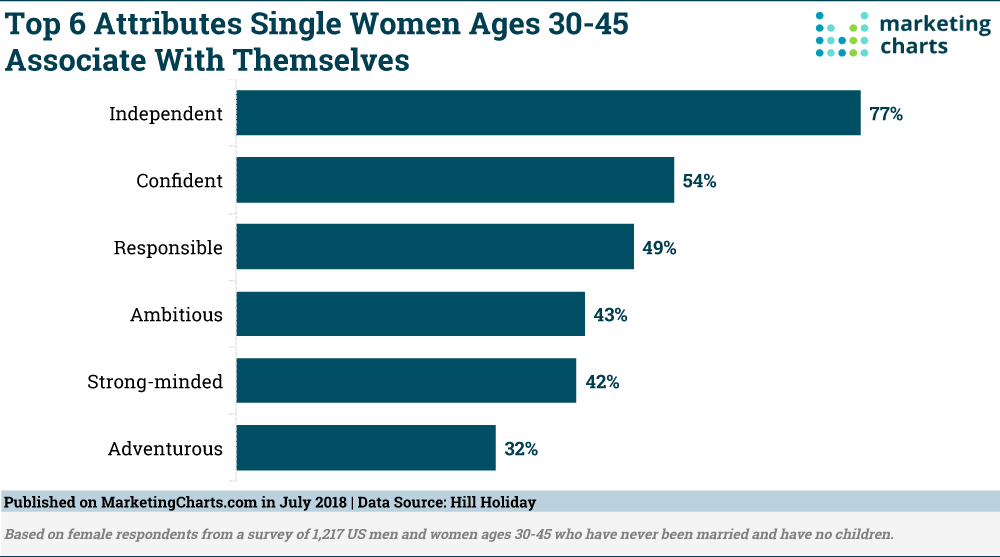
Read MoreHow Single 30-45 Women See Themselves [CHART]
Adults in the US are increasingly putting off marriage until later years, if at all. Indeed, a recent Pew Research Data analysis indicates that 57% of 21-36-year-olds have never married, compared to just one-third (33%) of people that age back in 1985.
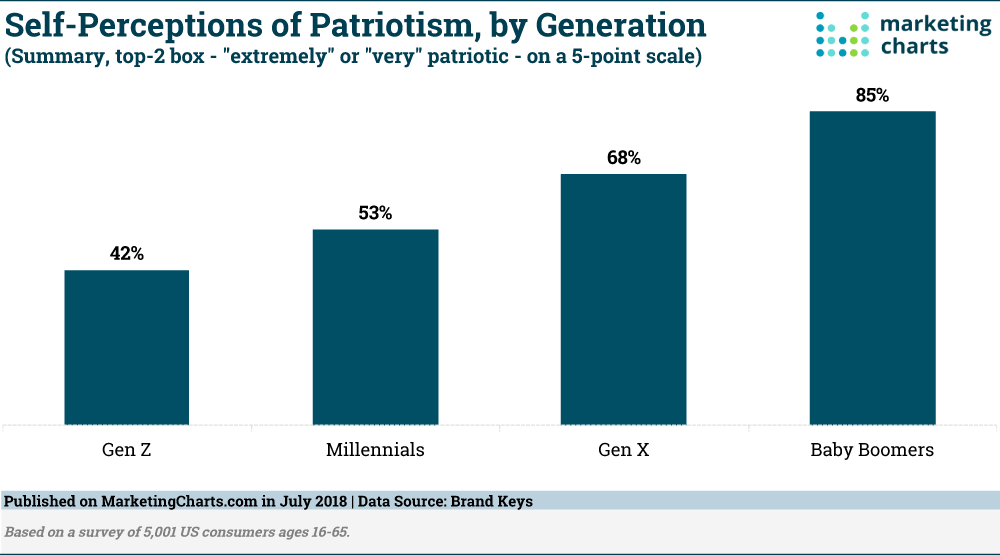
Read MorePatriotism By Generation [CHART]
In its survey of 5,001 consumers ages 16-65, Brand Keys found that just 42% of Gen Z respondents identify as ‘extremely’ or ‘very’ patriotic, as do only a slim majority (53%) of Millennials.
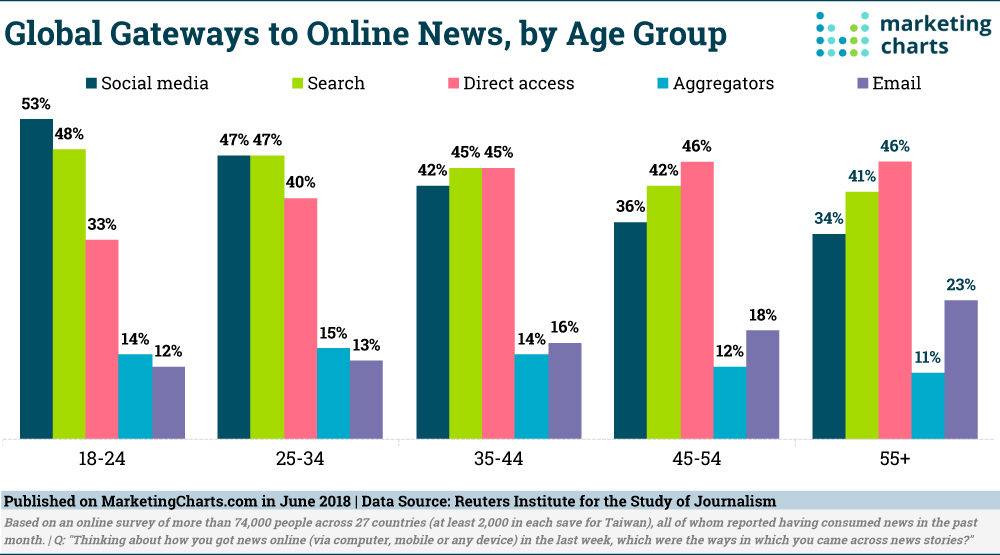
Read MoreOnline News Gateways By Age [CHART]
Social media is the main way that youth (18-24) around the world discover news online, whereas older adults are more apt to directly access news stories, according to the Digital News Report 2018 from the Reuters Institute for the Study of Journalism. Fully 53% of young adults reported coming across news stories via social media, compared to one-third (34%) of adults ages 55 and older.
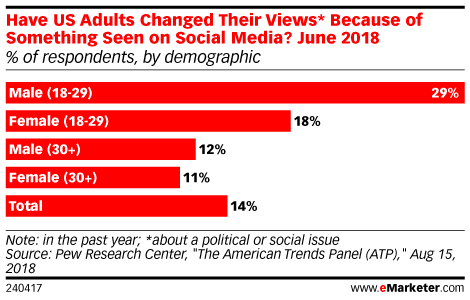
Read MoreSocial Media Persuasion By Demographic [CHART]
We may believe we’re each living in our own social media bubble full of like-minded folks, but survey data suggests that some of us are being persuaded to change our minds thanks to social posts.
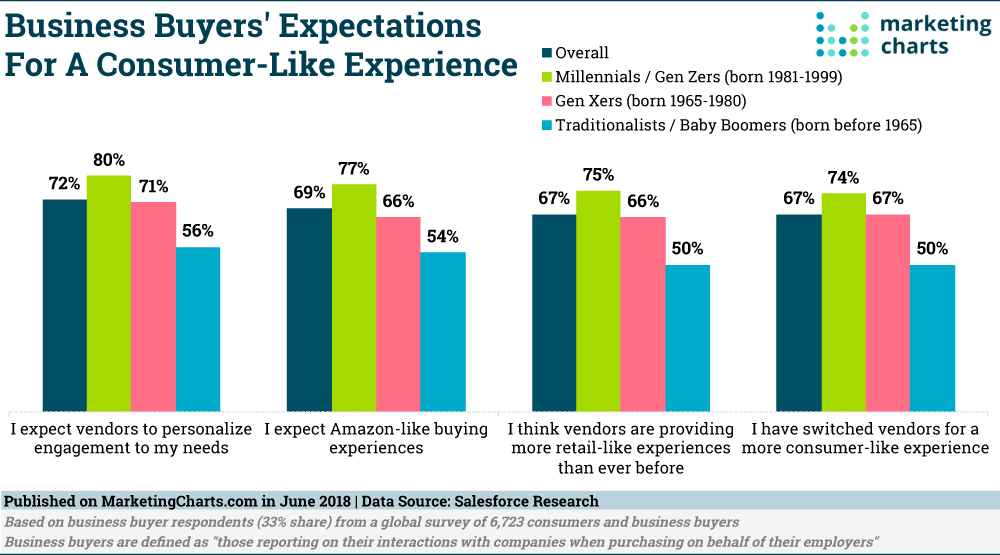
Read MoreB2B Buyers' Customer Experience Expectations by Generation [CHART]
More than 8 in 10 business buyers want the same experience as when they’re buying for themselves, reveals Salesforce Research in its second annual State of the Connected Consumer report. The study indicates that the customer experience is hugely important to business buyers, 8 in 10 of whom say the experience a company provides is as important as its products and services.
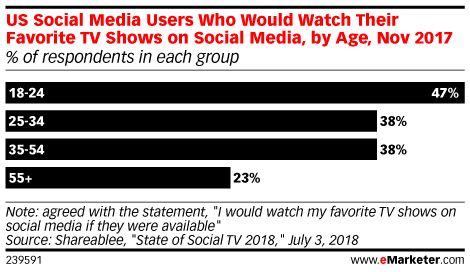
Read MoreSocial Television Appeal By Generation [CHART]
Long-form video is spreading across social media. With the launch of IGTV, Instagram joined Facebook, Snapchat and Twitter in a space getting more crowded by the day.
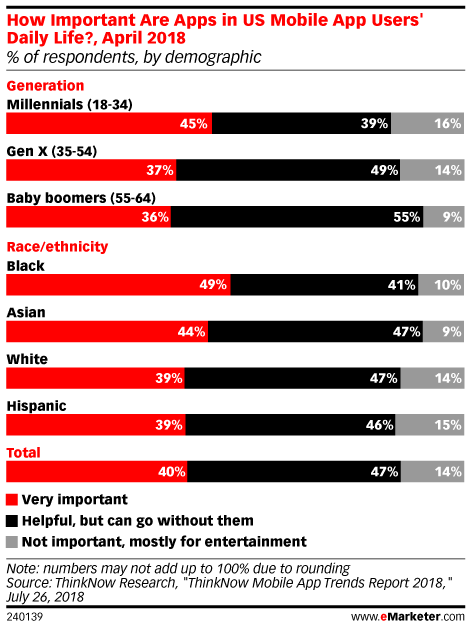
Read MoreImportance Of Mobile Apps By Generation [CHART]
In an April 2018 survey by ThinkNow Research, 40% of US mobile app users said apps were Very Important in their daily life. Millennials were slightly more likely to feel this way, though not by much.
Read More11 Essential Marketing Skills [INFOGRAPHIC]
This infographic from Maryville University illustrates the importance of eleven essential marketing skills that business innovators should master.
Read More