Email Marketing
Share Of eCommerce Visits By Traffic Source, Q4 2012-Q4 2013 [CHART]
Search accounted for 32.6% of website visits, up from 29.8% a year earlier, and leaps and bounds ahead of both email (2.7%) and social (1.1%).
Read MoreDaily Mobile Activities, February 2014 [CHART]
Smart phone owners spend a whopping 3.3 hours per day on their phones, while tablet owners are close behind, averaging 3.1 hours a day on their devices.
Read MoreFrequency Of Email Testing [CHART]
64% of B2C organizations routinely track tests through the entire funnel.
Read MoreTop Email Marketing Tactics Worldwide, February 2014 [CHART]
Just 28% of marketers polled worldwide said their company was optimizing email for mobile devices.
Read MoreDesktop vs. Mobile eCommerce Generated By Email Marketing, Q4 2013 [CHART]
Mobile email’s share of all opens grew 5% last quarter to claim 55% of the total.
Read MoreImportance Of National vs Local Online Tactics, December 2013 [CHART]
While nearly three-quarters of digital brand marketers in the region invested in local marketing, just 8% were Completely Satisfied with such efforts.
Read MoreMost Effective Email Marketing Tactics, February 2014 [VIDEO]
Closely grouped at the top are 3 main goals: improving lead nurturing (52%); improving click-through rates (50%); and increasing website traffic (49%).
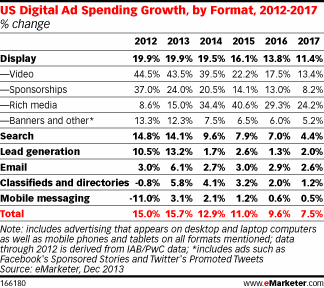
Read MoreUS Online Ad Spending Growth By Format, 2012-2017 [TABLE]
Programmatic buying, native advertising and viewability all remain topical to digital display advertisers, particularly brands.
Read MoreHappy eCommerce Customers [INFOGRAPHIC]
This infographic by Yovigo illustrates what makes eCommerce customers happy.
Read MoreGlobal Traveler, 2014 [INFOGRAPHIC]
This infographic from LastRoom paints a picture of the behavior of the global traveler of 2014.
Read More

