Email Marketing
Buyer's Journey Budgeting [INFOGRAPHIC]
This buyer’s journey budgeting infographic from IBM and The CMO Club illustrates that content generation is the biggest expenditure for the CMOs surveyed.
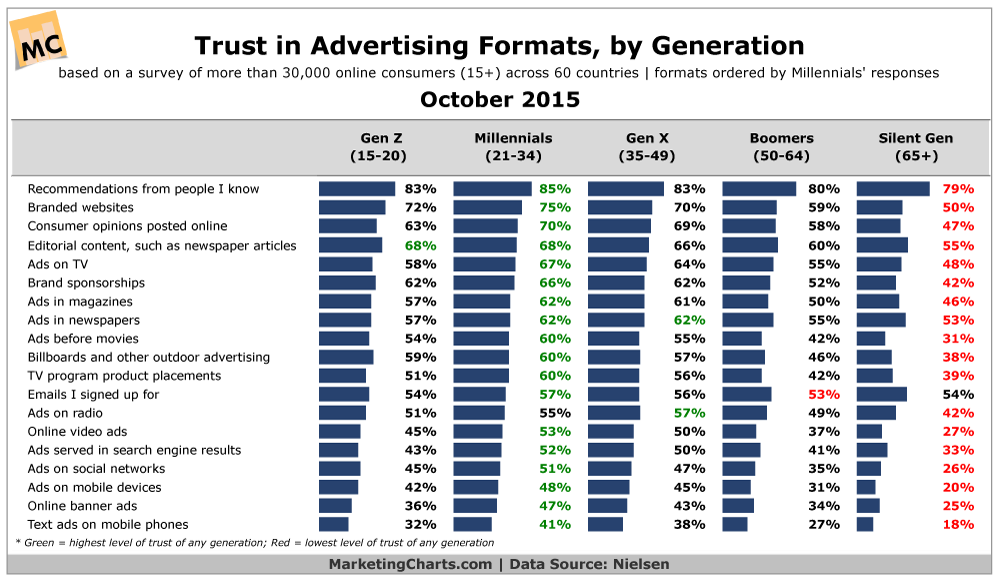
Read MoreTrust In Advertising Formats By Generation, October 2015 [CHART]
Millennials report the highest levels of trust in advertising almost all of the 19 formats listed.
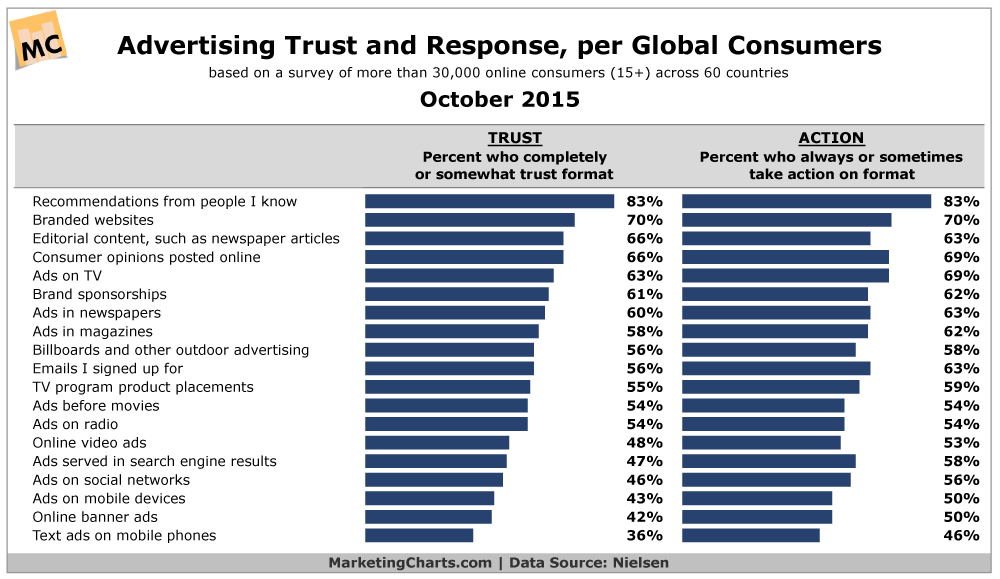
Read MoreTrust In Advertising By Format, October 2015 [CHART]
Among paid media channels, traditional media outperform online and mobile ads in trust.
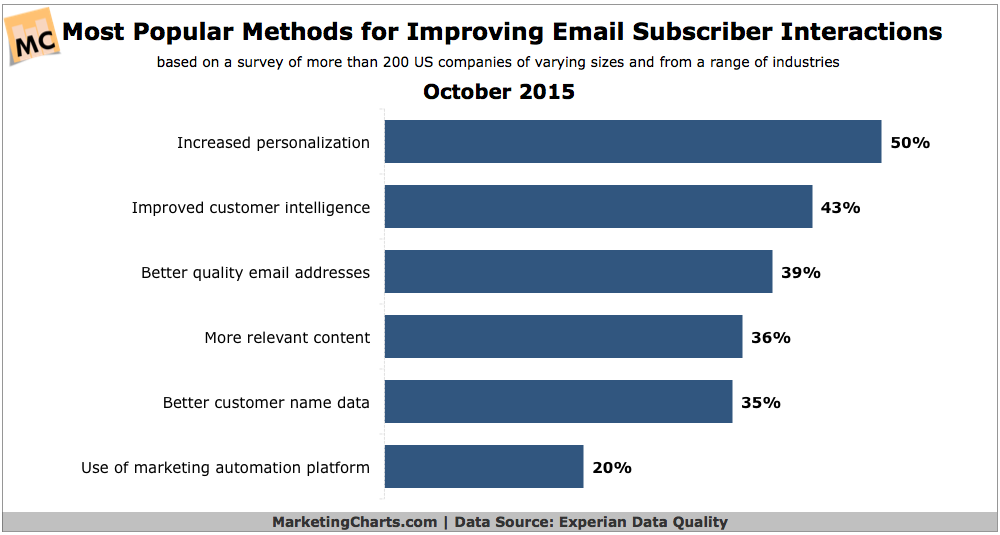
Read MoreTop Ways To Improve Email Subscriber Interactions, October 2015 [CHART]
Increased personalization ranks as the leading method by which companies feel they can improve email interaction among subscribers.
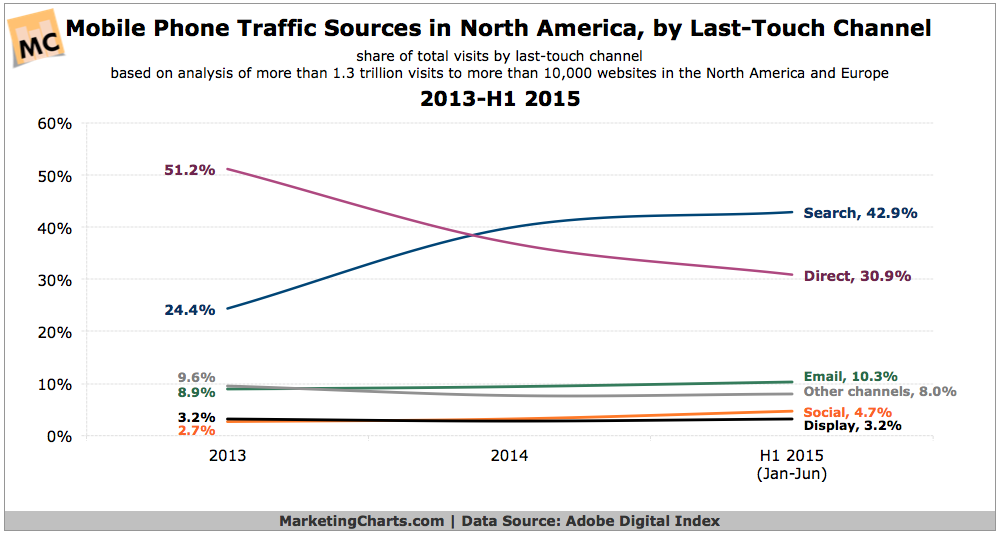
Read MoreTypes Of Mobile Phone Internet Traffic, 2013-2015 [CHART]
Over the past couple of years, search has overtaken direct as the leading referrer of mobile phone traffic in North America.
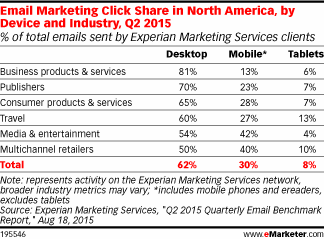
Read MoreMarketing Email Click Share By Industry, Q2 2015 [TABLE]
On average, 62% of clicks happened on the desktop—14 percentage points ahead of the desktop share of opens.
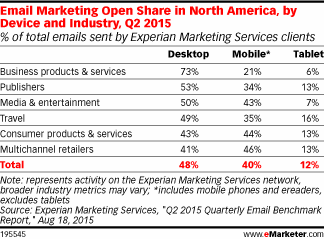
Read MoreMarketing Email Open Share By Industry, Q2 2015 [TABLE]
Overall, 48% of all marketing emails sent by Experian clients were opened on the desktop,
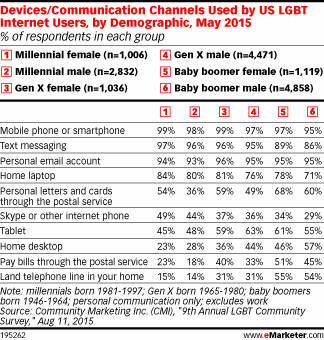
Read MoreCommunication Devices Used By LGBT By Generation, May 2015 [TABLE]
Age has a significant effect on how LGBT internet users behave when it comes to communication channels and devices, both digital and traditional.
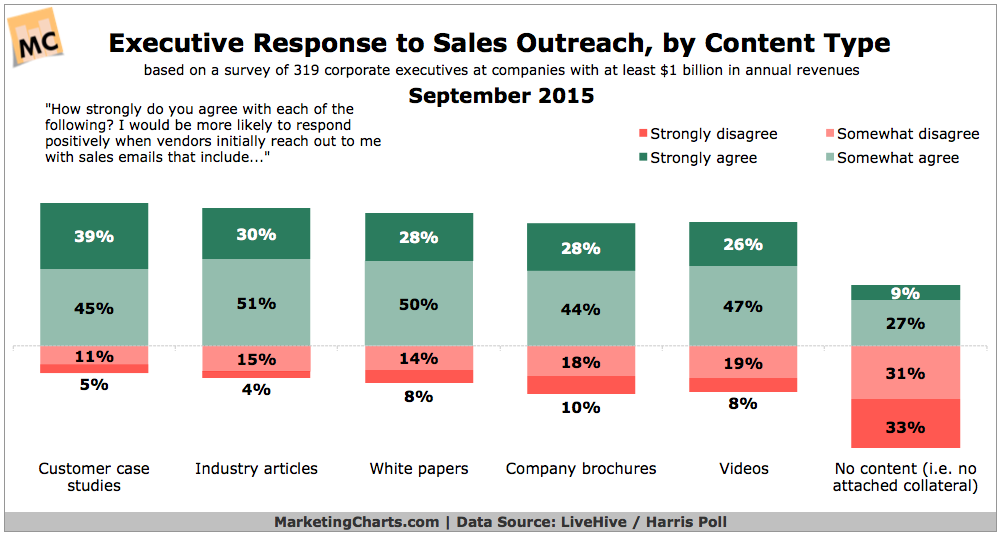
Read MoreTypes Of Sales Emails Executives Respond To, September 2015 [CHART]
More than 6 in 10 executives and enterprise companies (more than $1 billion in annual revenues) say they receive personalized sales outreach from vendors at least often.
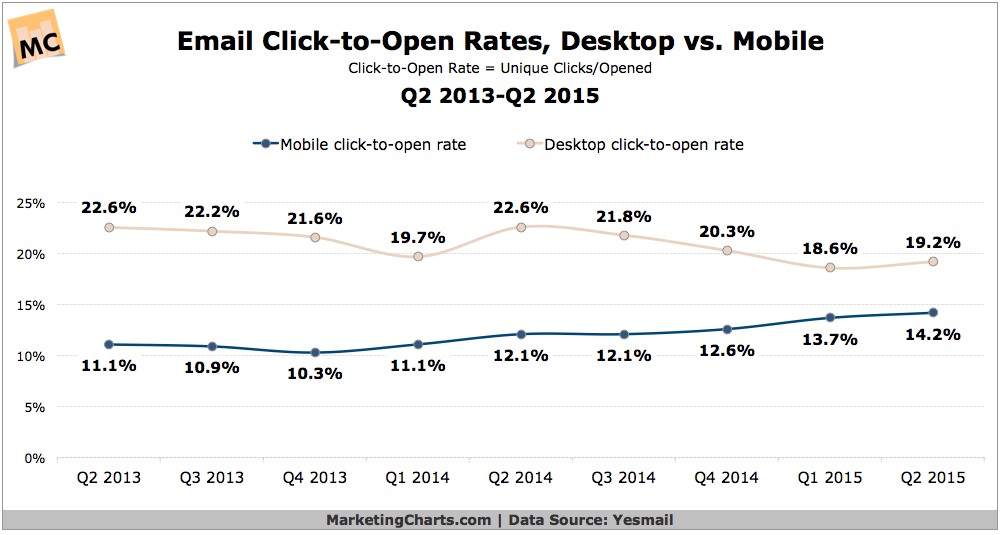
Read MoreEmail Click-To-Open Rates, 2013-2015 [CHART]
Mobile devices have represented the majority of email opens for some time now, but studies have shown that PC users tend to click more than mobile users.
Read More
