eCommerce
American Hispanics' Social Shopping Activities, May 2012 [CHART]
While 48% of Hispanics involved social networking sites in their shopping activities, only 31% of non-Hispanics did so.
Read MoreAmerican Hispanic Mobile Shoppers By Device, May 2012 [CHART]
Not only are Hispanics more likely than non-Hispanics to use a smartphone, but they’re a lot more likely to shop with it.
Read MoreAmericans' Online Privacy Concerns, January 2013 [CHART]
Roughly 9 in 10 online adults in the US worry about their privacy online at least sometimes.
Read MoreMobile Shopper Activities By Device Type, January 2013 [CHART]

Tablet owners are more than twice as likely to use their device for shopping as smartphone owners (44% vs. 20%).
Read MoreConsumer vs. Professional Reviews' Influence Over Electronics Purchase By Device, September 2012 [CHART]
Shoppers were more likely to pay attention to consumer reviews than professional reviews across every product category.
Read MoreMobile Consumers' Attitudes Toward Shopping Apps, December 2012 [CHART]
Two-fifths of smartphone and tablet shoppers said using a shopping app strengthened their connection to the brand.
Read MoreLuxury Marketing Content & Tactics, October 2012 [CHART]
The most popular approach among content, conversation and product-promotion tactics: posting product imagery, which 81% were using.
Read MorePreferred Online Channels Of Luxury Marketers, October 2012 [CHART]
Facebook is presently seen as the key social platform; 95% of luxury marketers said they were actively engaging customers there.
Read MoreTime Spent Online By Gender & Generation, 2011 vs 2012 [CHART]
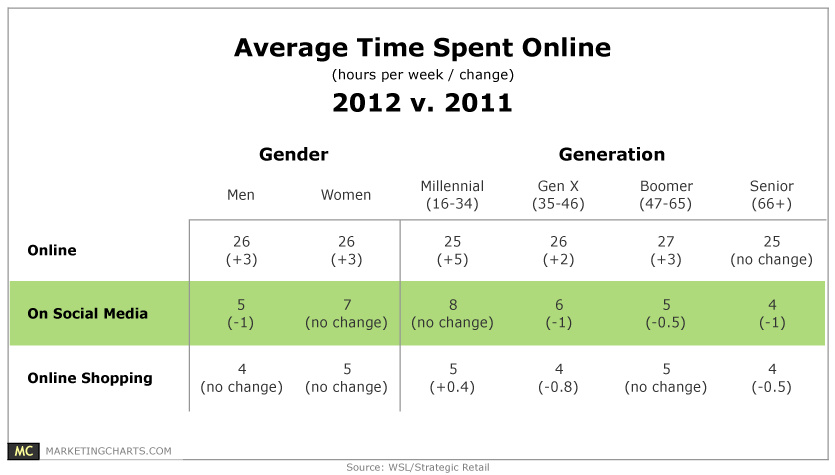
Online Americans spent slightly more than one day a week online last year, increasing their average online time by 3 hours to 26 hours.
Read MoreHoliday eCommerce Traffic Sources, January 2013 [CHART]
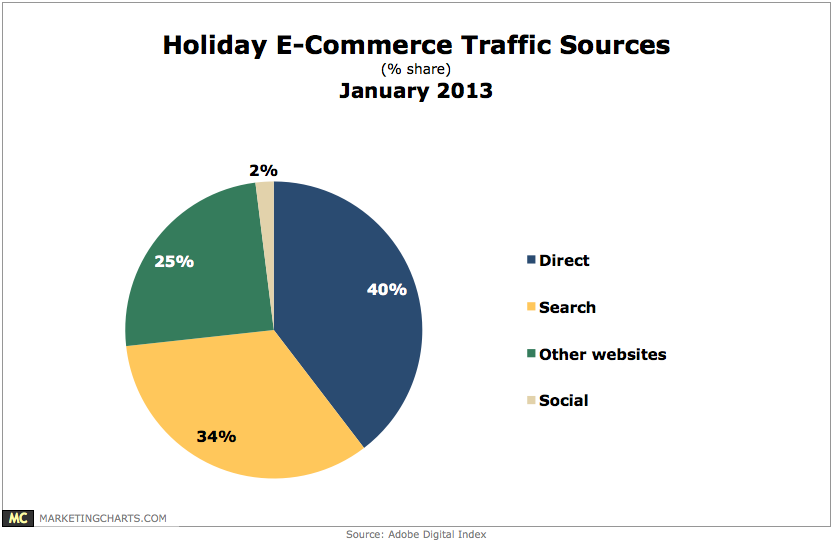
Only 2% of traffic to retailers during the holiday season came from social networks.
Read More