eCommerce
Frequency Of College Students' Mobile Purchases, November 2012 [CHART]
70% of college students made mobile purchases, and 52% did so at least once a month.
Read MoreIn-Store Mobile Activities Of African Americans, March 2013 [CHART]
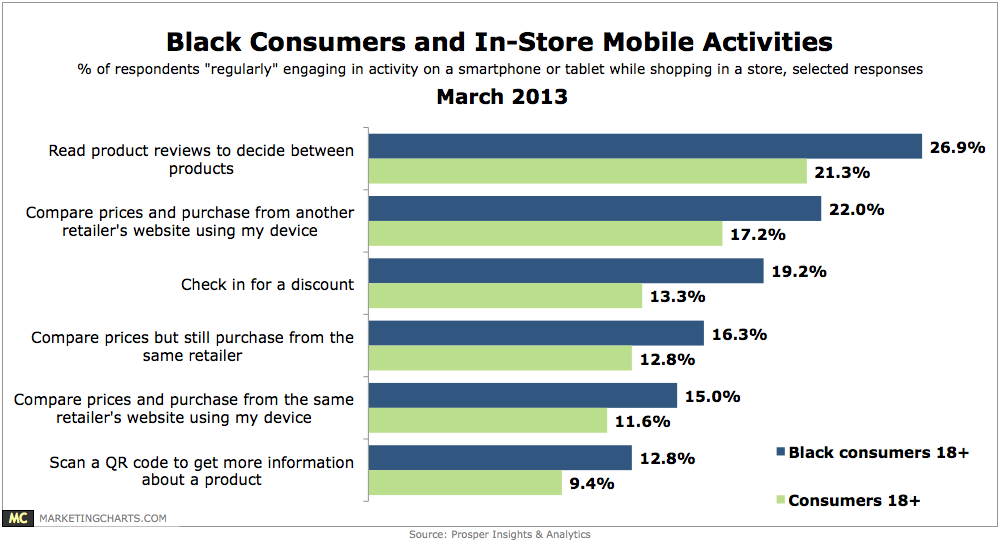
African Americans are 44% more likely to check in for a discount and 37% more likely to scan a QR code to get more information about a product.
Read MoreTop Motivations For Shopping Online, March 2013 [CHART]
Asked to identify the top-3 improvements to their online shopping experiences that would motivate them to shop more, 74% of consumers cited free delivery.
Read More
Agency Perceptions Of Client Online Marketing Talent Gaps, March 2013 [CHART]
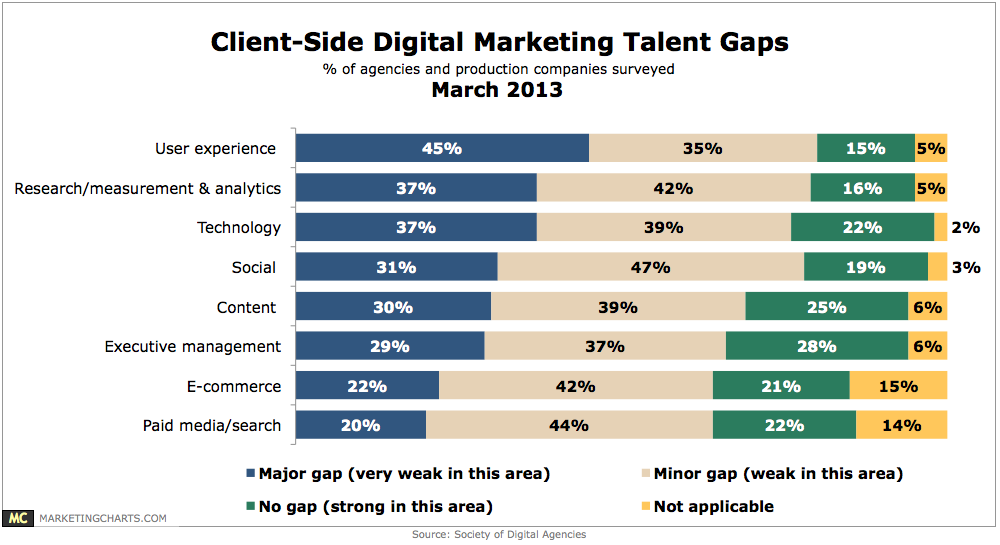
80% of agencies and production companies pointed to user experience (UX) as a major (45%) or minor (35%) talent gap among clients.
Read MoreUS Online Travel Booking Revenues By Segment, 2010 & 2014 [TABLE]
Almost 60% of online cruise bookings in 2014 will come via supplier websites, with the remaining purchased via online travel agencies.
Read MoreConversion Rates For American Visitors To Travel Websites By Category, January 2011 – March 2012 [CHART]
The monthly average for conversions via cruise sites was less than 1% between January 2011 and March 2012.
Read MoreeCommerce vs. Bricks & Mortar Customer Satisfaction, 2000-2012 [CHART]
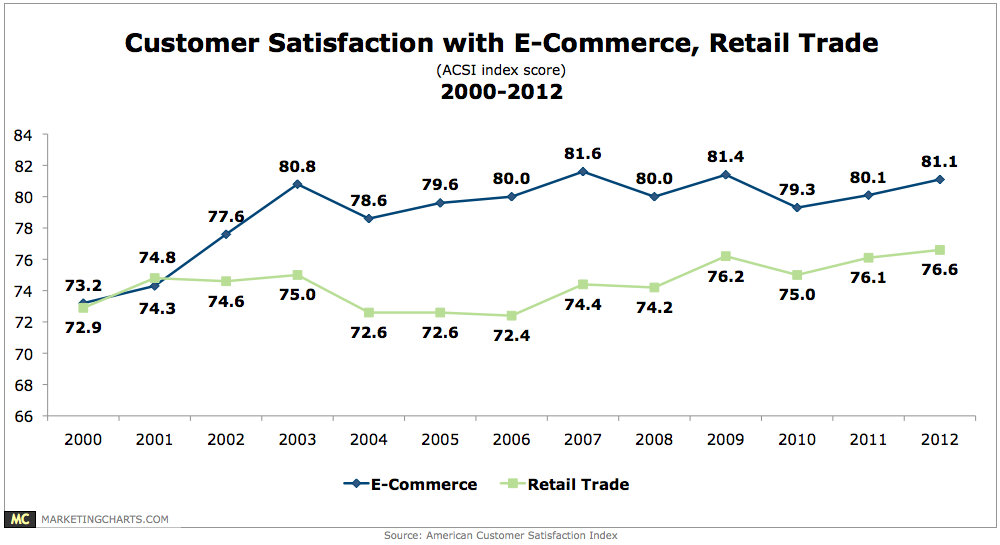
Customer satisfaction with e-commerce sites improved in 2012, outpacing satisfaction ratings with traditional retail stores for the 11th consecutive year.
Read MoreAmazon Showrooming, March 2013 [CHART]
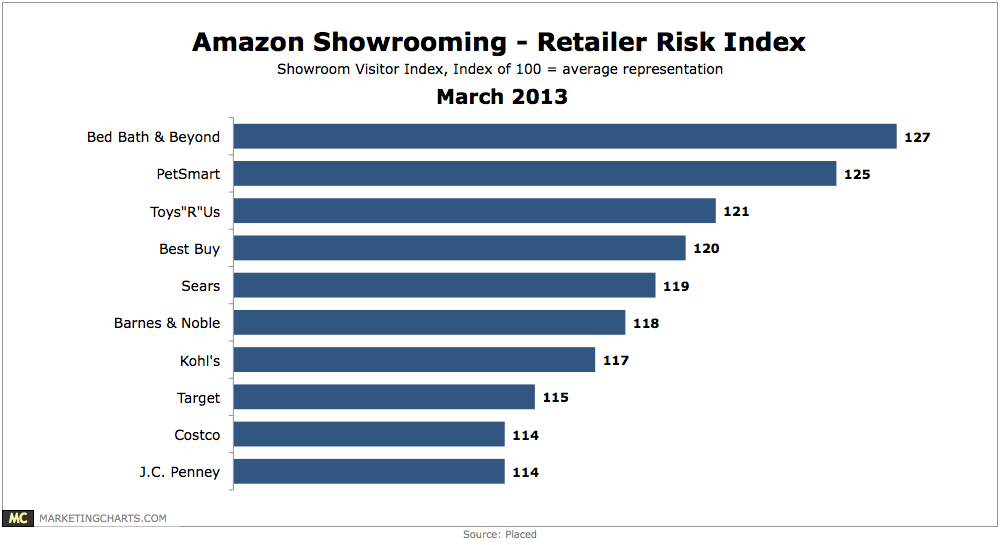
Study looks at which retailers are most at risk of showrooming behavior, by examining showroomers’ propensity to visit the retailer before buying an item on Amazon.
Read MoreTop 10 Websites By Share Of Mobile Visits, February 2013 [CHART]
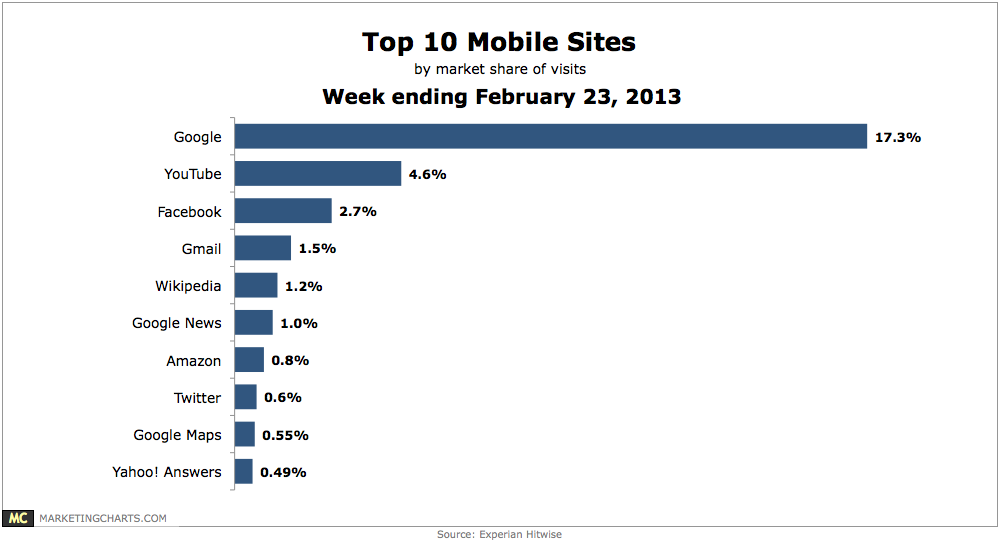
Google ranks as the top site, with 17.3% market share of visits.
Read More