eCommerce
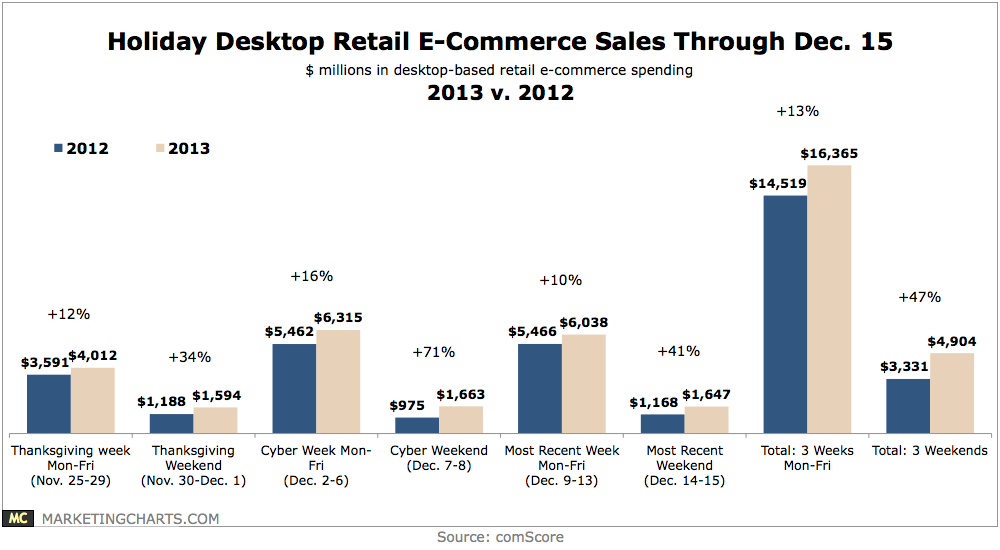
Holiday Desktop Retail eCommerce Sales Through December 15, 2012 vs 2013 [CHART]
Mobile shopping may be on the rise this holiday season, but that doesn’t appear to be affecting desktop e-commerce sales.
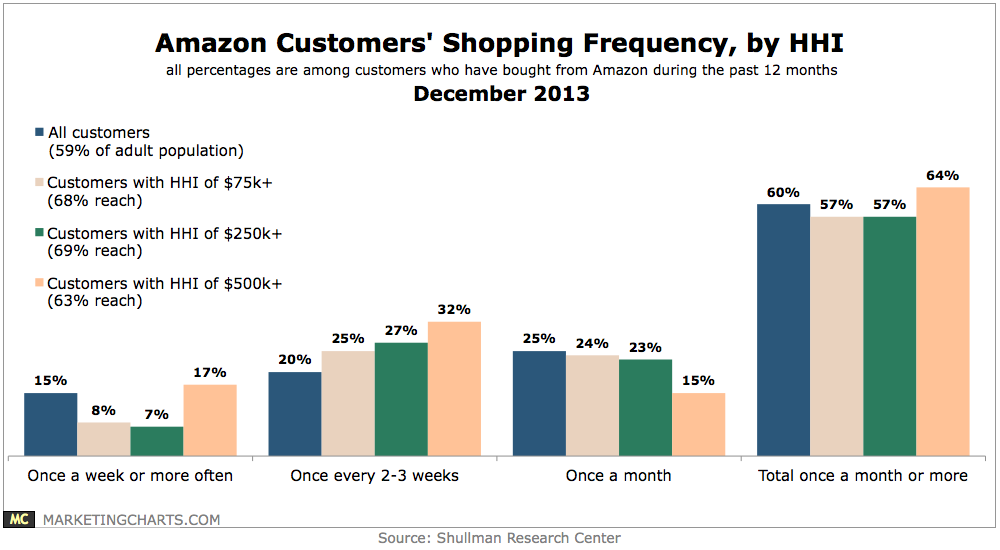
Read MoreAmazon Customers' Shopping Frequency By Household Income, December 2013 [CHART]
Amazon customers’ average household income is roughly $89,000, compared to the $71,000 average for the US as a whole.
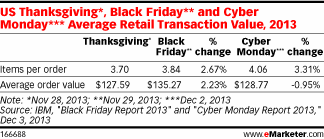
Read MoreUS Holiday Average Retail Transaction Value, 2013 [TABLE]
Adobe reported that online retail holiday sales were up 18% on Thanksgiving, a whopping 39% on Black Friday and 16% on Cyber Monday.
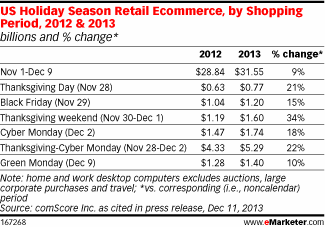
Read MoreUS Holiday Retail eCommerce By Shopping Period, 2013 vs 2012 [TABLE]
Overall, for the period beginning November 1 and ending December 9, digital retail sales were up 9%.
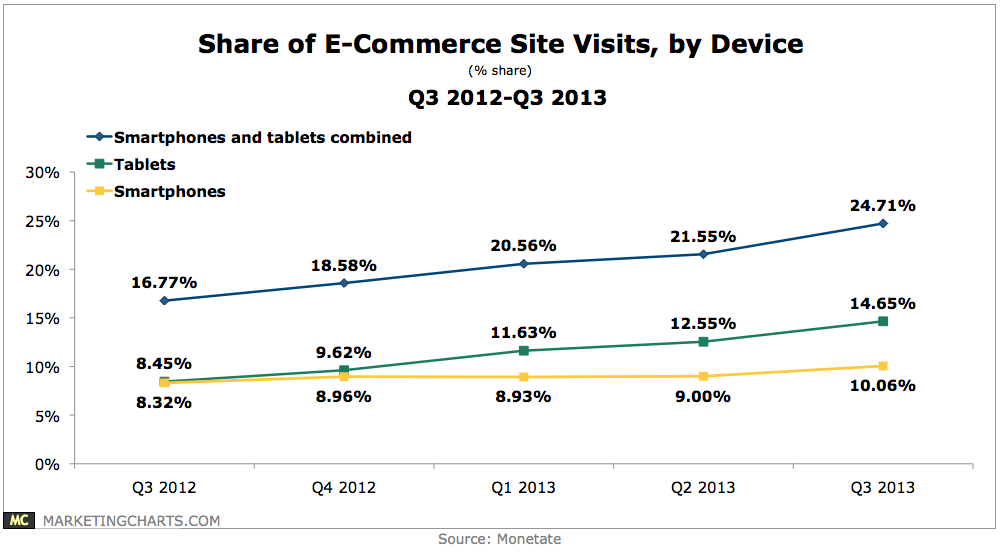
Read MoreShare Of eCommerce Site Visits By Device, Q3 2012-Q3 2013 [CHART]
During the third quarter of the year, smart phones (10.1%) and tablets (14.7%) combined to account for roughly one-quarter of visits to eCommerce websites.
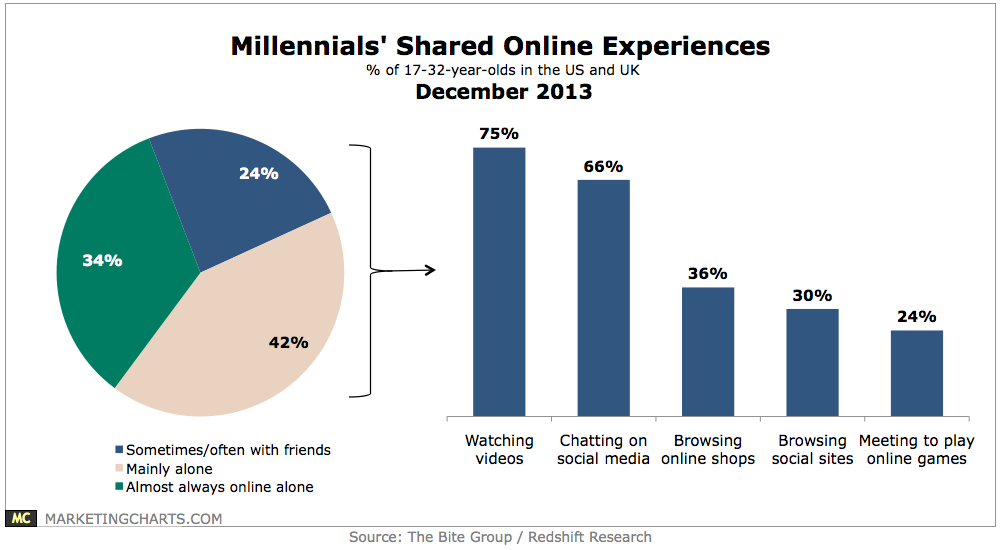
Read MoreMillennials' Shared Online Experiences, December 2013 [CHART]
Two-thirds of Millennials said they share at least some social experiences online.
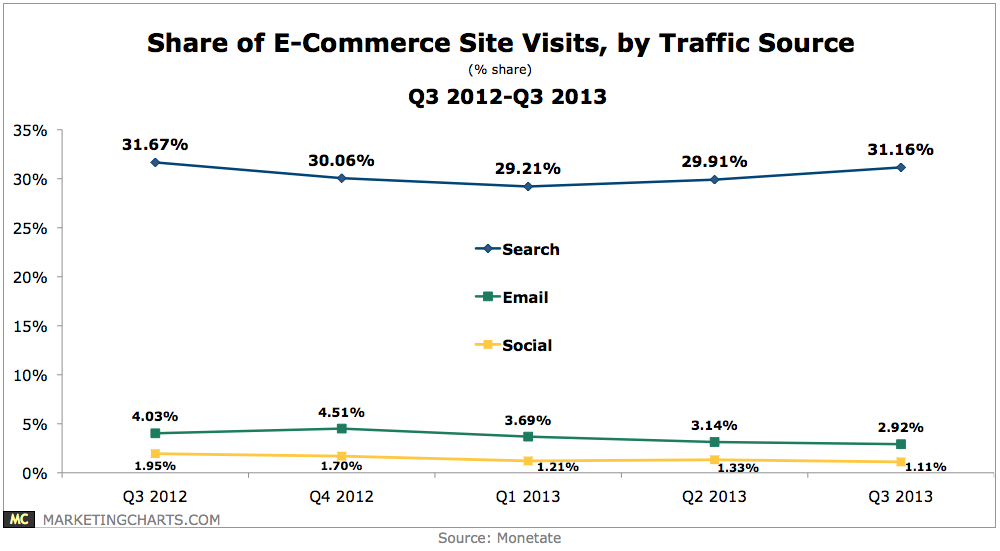
Read MoreShare Of eCommerce Site Visits By Traffic Source, Q3 2012-Q3 2013 [CHART]
Email is accounting for a shrinking share of e-commerce site visits, according to the latest quarterly report from Monetate.
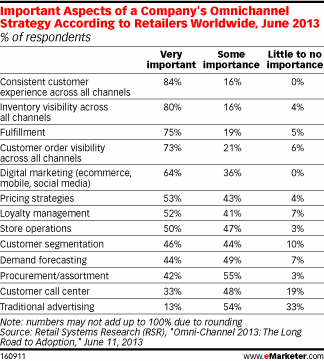
Read MoreImportant Elements Of Retailers' Omnichannel Strategy, June 2013 [TABLE]
84% of retailers worldwide said that creating a consistent customer experience across channels was very important.
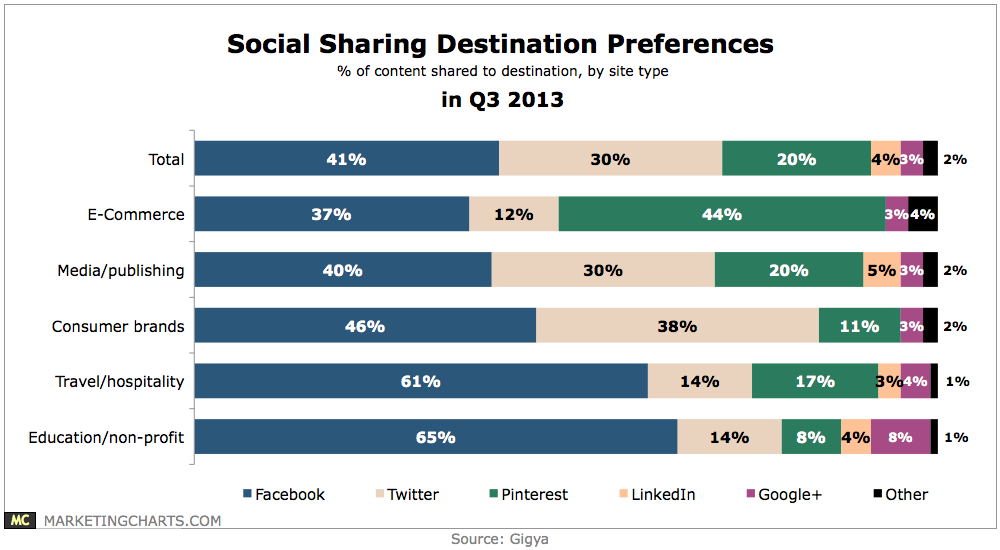
Read MoreSocial Sharing Destination Preferences, Q3 2013 [CHART]
About 20% of content shared to social networks was shared to Pinterest during Q3, up from 16% in Q2.
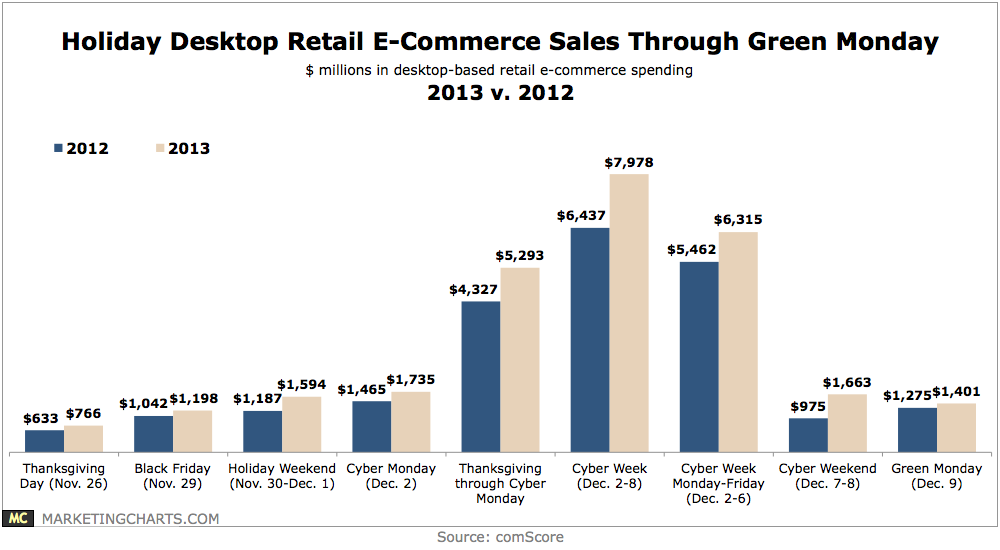
Read MoreHoliday Desktop eCommerce Sales Through Green Monday, 2012 vs 2013 [CHART]
Desktop retail e-commerce sales grew by 10% year-over-year on Green Monday (the Monday with at least 10 days until Christmas – typically the second Monday of December) to reach $1.4 billion.
Read More