Display Advertising
Global Ad Spending By Medium, 2012 vs 2015 [CHART]

By 2015, the internet should account for 23.4% of global ad spending, details Zenith Optimedia in a new forecast.
Read MoreMost Annoying Types Of Online Ads, March 2013 [CHART]
Among types of online ads, irrelevant pop-up ads irked the greatest percentage of respondents (79%).
Read MoreConsumer Interest In Targeted Online Ads, April 2013 [CHART]
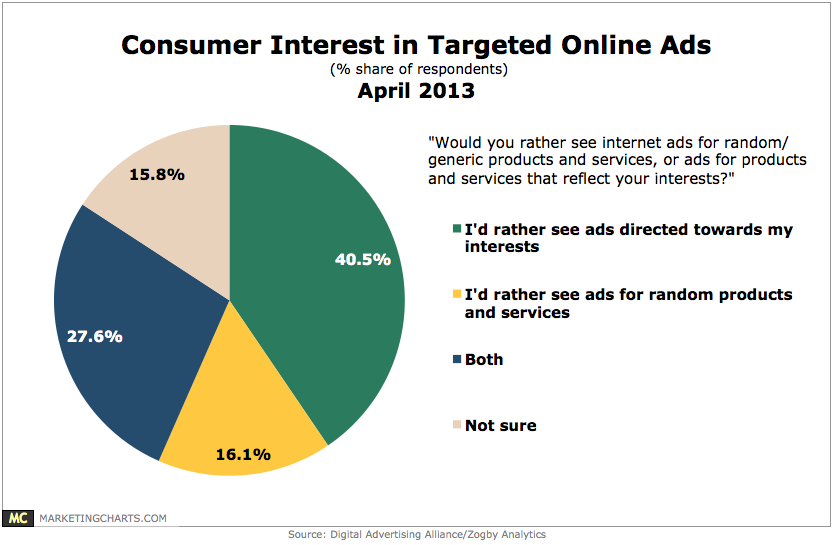
40.5% of consumers would rather see ads directed towards their interests rather than random ads, while another 27.6% were content to see both.
Read MoreGlobal Ad Spending Growth By Media, 2012 [CHART]

TV, which commands the lion’s share of global ad budgets, saw a 4.3% increase in expenditures for the year, reaching $350 billion.
Read MoreUS Desktop vs Mobile Social Media Ad Spending, 2012-2017 [TABLE]
Mobile-social spend is expected to rise by a CAGR of 30% over the forecast period.
Read MoreUS Social Media Ad Spending By Type, 2012-2017 [TABLE]
This year native spending will account for nearly 40% of total social media ad spending.
Read MoreTop Online Ad Formats By Share Of Revenue, 2011 vs 2012 [CHART]
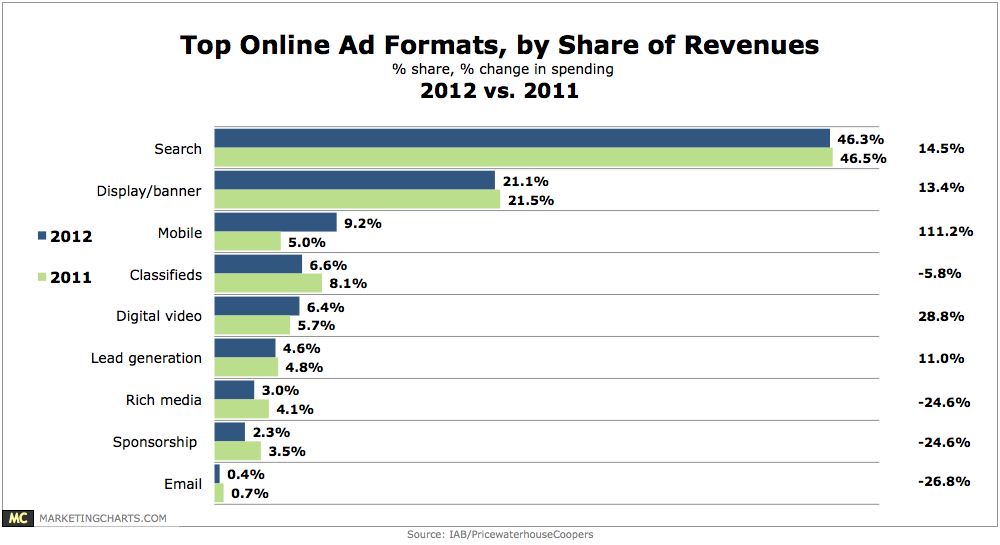
Online ad revenues grew by 15% year-over-year in 2012.
Read MoreAdvertising Efficacy By Media, April 2013 [TABLE]
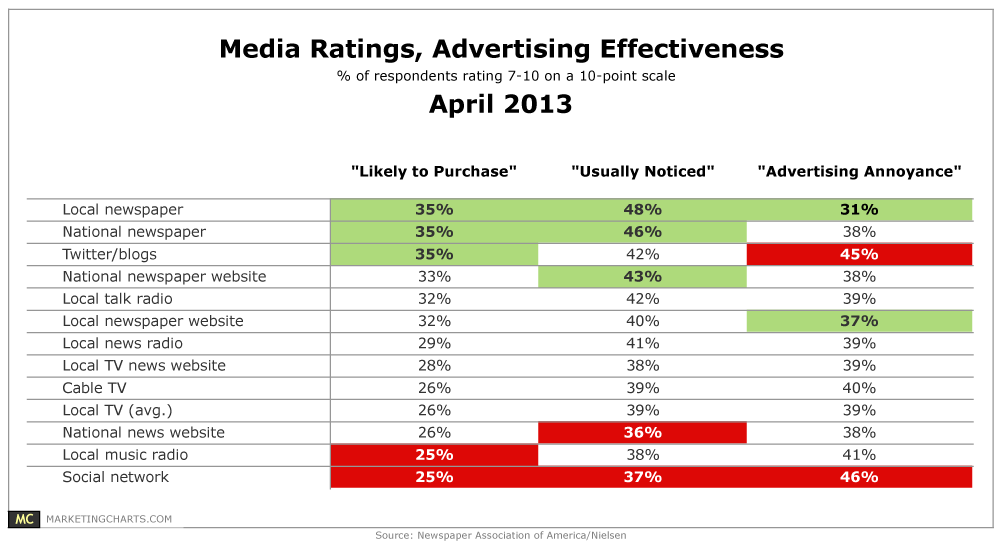
An online survey of 5,000 US adults reveals that respondents rate newspapers as the most effective advertising source among various media.
Read MoreUS Online Ad Revenues, 2003-2012 [CHART]
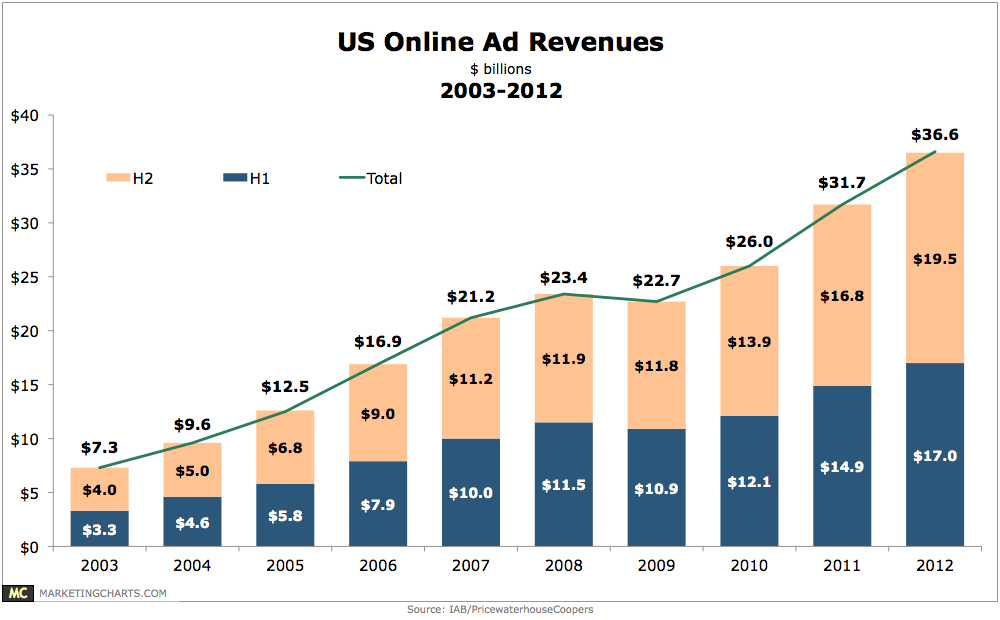
Online ad spend has reached a new peak, hitting $10.31 billion in Q4, up 14.9% year-over-year.
Read MoreOnline Ad Price Trends By Ad Type, January vs March 2013 [CHART]
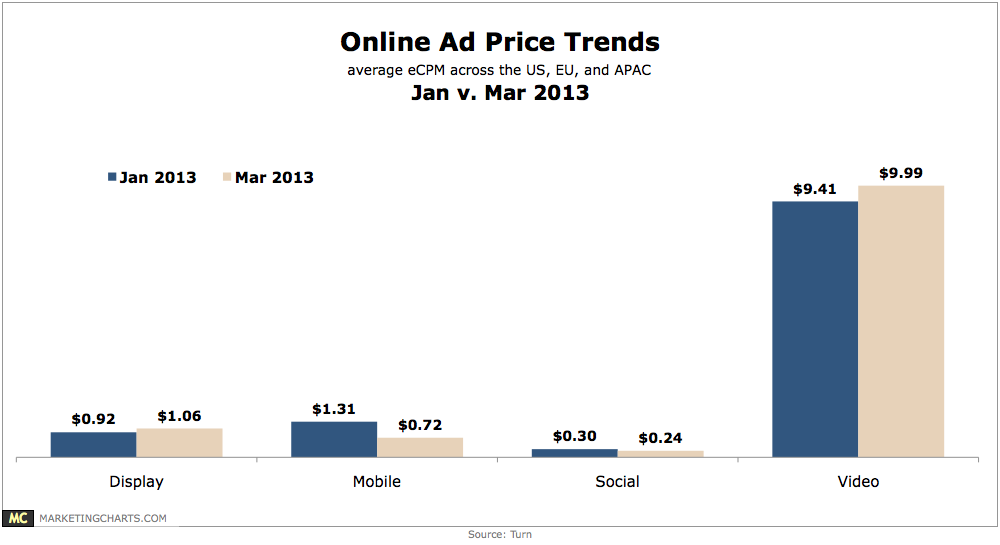
Average video eCPMs increased 6.2% between January and March 2013, from $9.41 to $9.99, while display ad prices grew by 15.2% from $0.92 to $1.06.
Read More