Digital Advertising
Video Completion Rates Of Rich Media Ads By Type & Size, 2013 [TABLE]
Clickthrough rates for rising stars were 70% higher than for standard placements, and video completion rates experienced a 19% lift.
Read MoreUS Online Ad Revenues, 2004-2013 [CHART]
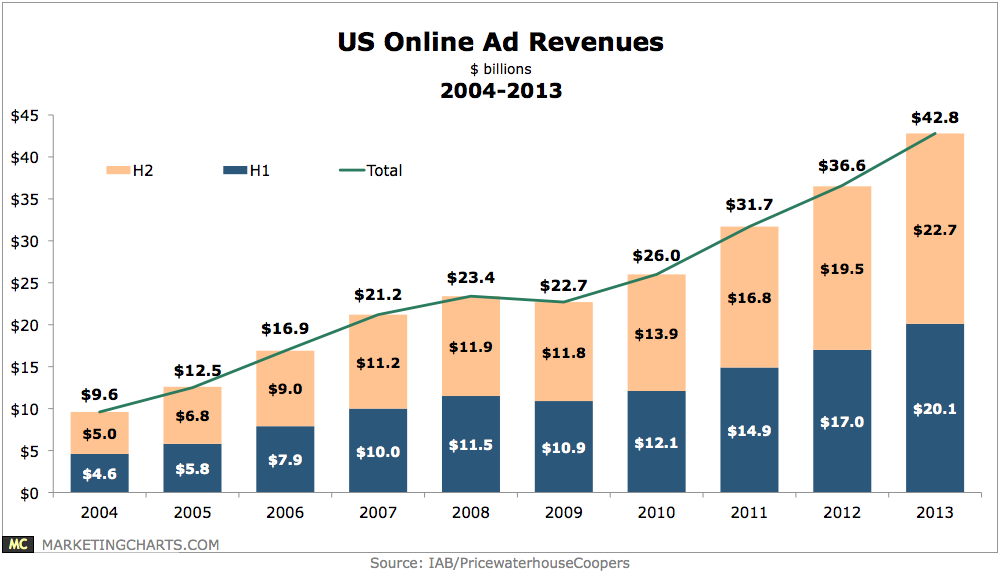
Online advertising set yet another peak in Q4 2013, growing by 17.5% to reach $12.1 billion, the largest quarter on record.
Read MoreRich Media Ad Benchmarks By Vertical, 2013 [TABLE]
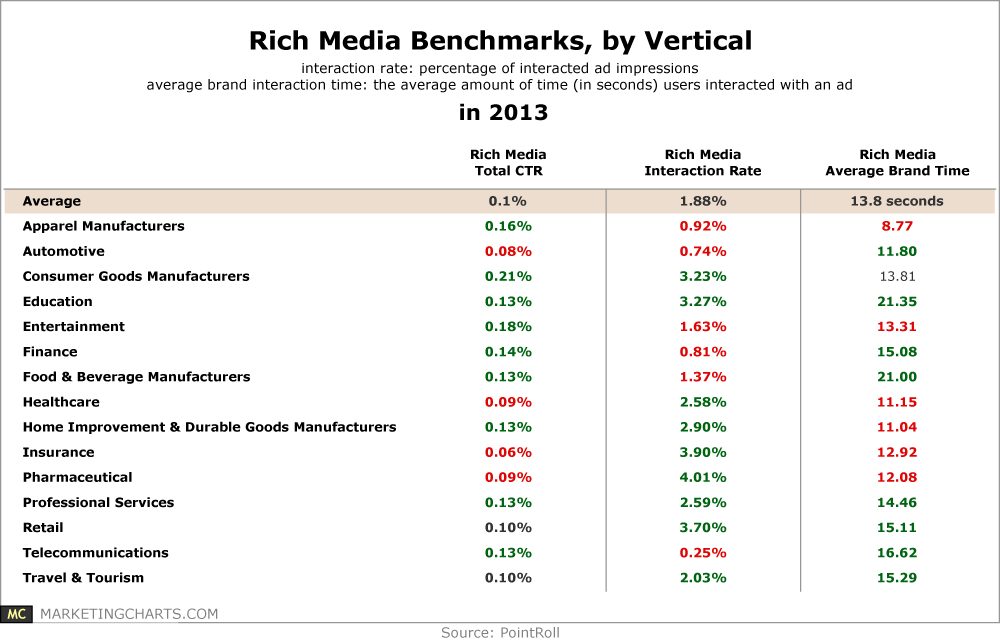
Rich media click-through and interaction rates were higher when including video.
Read MoreLocal Ad Spending Forecast, 2013-2018 [CHART]
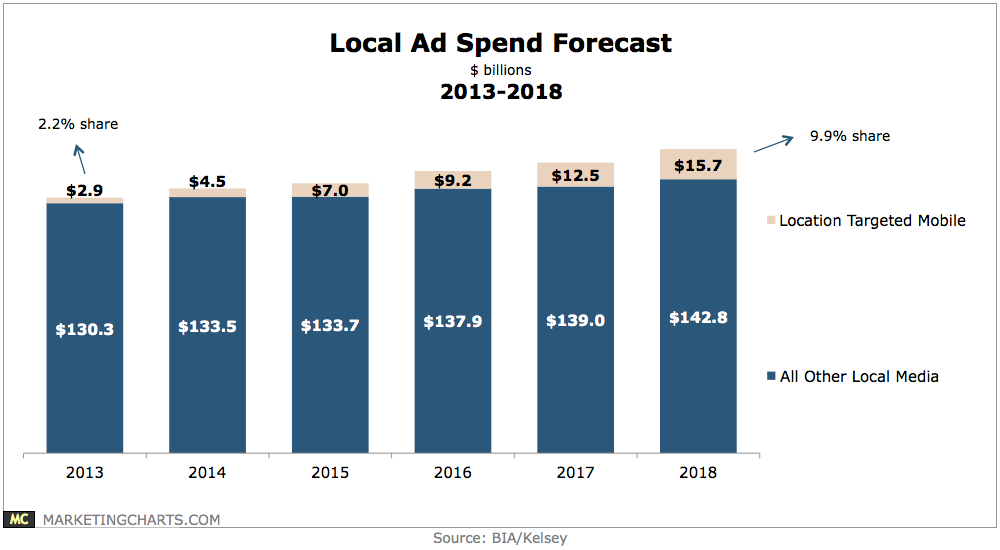
US mobile ad spend is projected to grow from $7.2 billion last year to $30.3 billion in 2018, with a slight majority 52% – or $15.7 billion – of that eventual figure being location-targeted spending.
Read MoreState Of Native Advertising, 2014 [INFOGRAPHIC]
Copyblogger solicited 2,088 people for their opinions on native advertising for this infographic.
Read MoreTop Contributors To Global Ad Spending Growth, 2013-2016 [CHART]

Mobile will be the prime contributor of new ad spending (accounting for 35% of it), and will grow to account for 7.6% of total ad spend in 2016.
Read MoreDisplay Ads That Are In-View By Timeframe & Platform, H2 2013 [TABLE]
Roughly half of US banner impressions served on advertising networks and exchanges in H2 2013 went unseen.
Read MoreMarketing Channels Most Often Used With Email, February 2014 [CHART]
More than six in 10 marketers worldwide said that landing pages were the marketing channel most often integrated with their email programs.
Read MoreGlobal Online Ad Spending Share, 2012-2018 [TABLE]
The US is still the single biggest spender on digital ads, with North America thus the highest-spending region.
Read MoreGlobal Online Ad Spending, 2012-2018 [CHART]
Spending on ads served to internet-connected devices including desktop and laptop computers, mobile phones and tablets will reach $137.53 billion this year.
Read More