Demographics
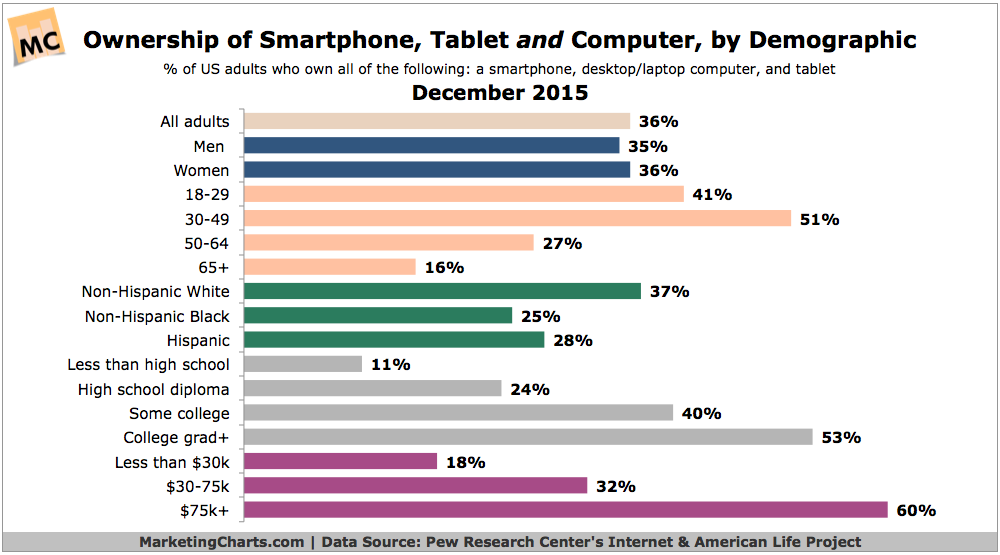
Smartphone, Tablet & Computer Ownership By Demographics
Some 36% of US adults own a smartphone, computer and tablet.
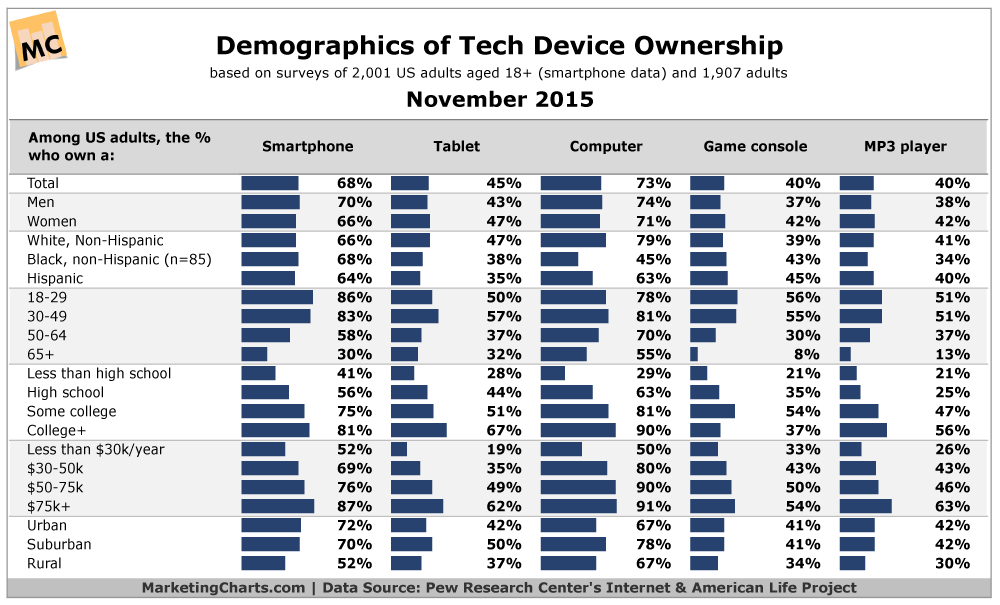
Read MoreTechnology Device Owner Demographics, November 2015 [CHART]
Slightly more than two-thirds of American adults (68%) now own a smartphone, representing a rapid rise from about half that proportion (35%) in mid-2011.
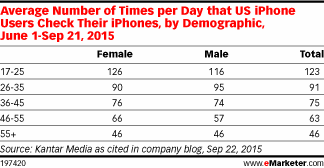
Read MoreHow Frequently iPhone Users Check Their Phones By Demographic [TABLE]
At the most basic level, boomers simply do not use smartphones as often as younger people do.
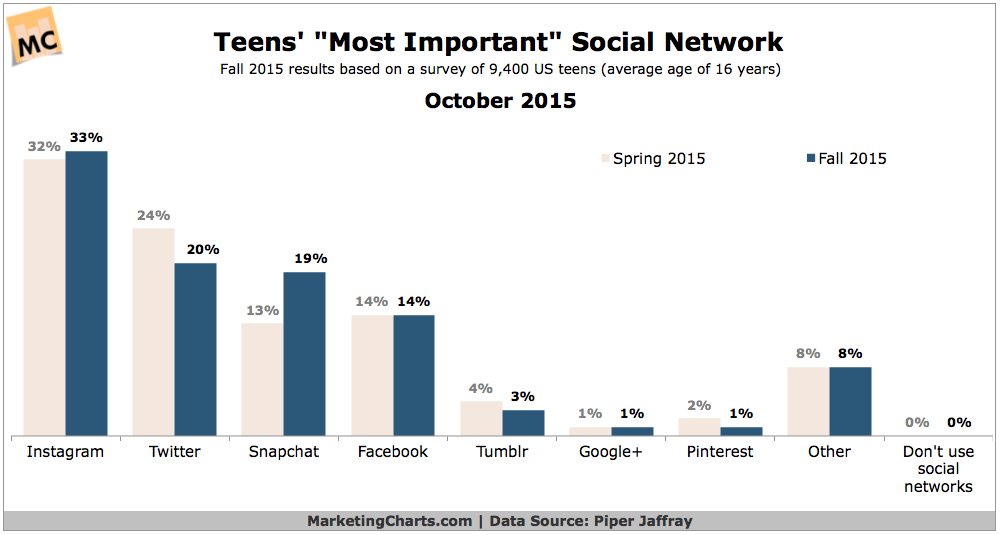
Read MoreMost Popular Social Sites For Teens, October 2015 [CHART]
Instagram continues to be at the top of the heap when it comes to teens’ most important social networks.
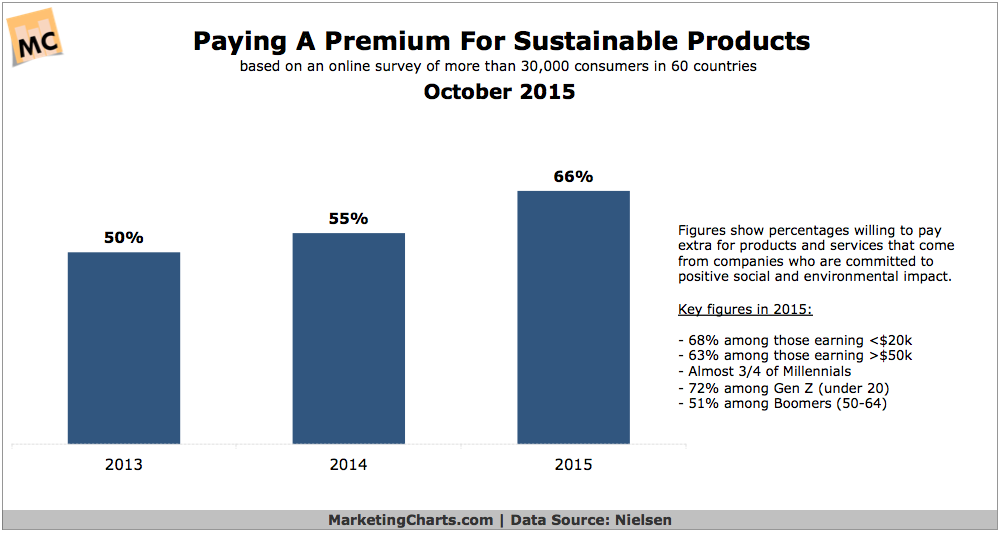
Read MoreConsumer Willingness To Pay More For Sustainable Products, October 2015 [CHART]
Consumer inclination to pay extra for sustainable products is on the rise. –
Read MoreThe Demise Of The American Middle Class [REPORT]
A new report from Pew Research details the demise of the American middle class.
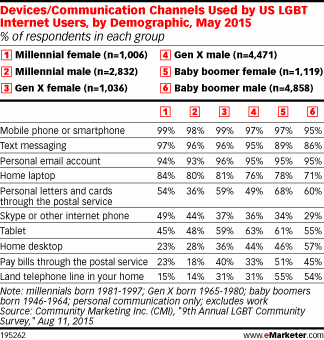
Read MoreCommunication Devices Used By LGBT By Generation, May 2015 [TABLE]
Age has a significant effect on how LGBT internet users behave when it comes to communication channels and devices, both digital and traditional.
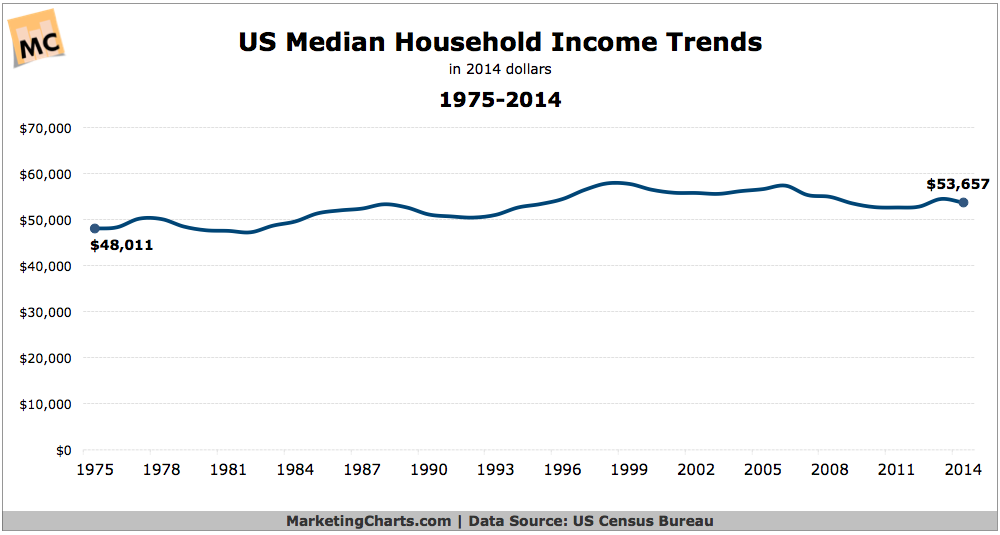
Read MoreMedian Household Income, 1974-2014 [CHART]
The median household income in the US was $53,657 last year, not statistically significant different in real terms from the 2013 estimate.
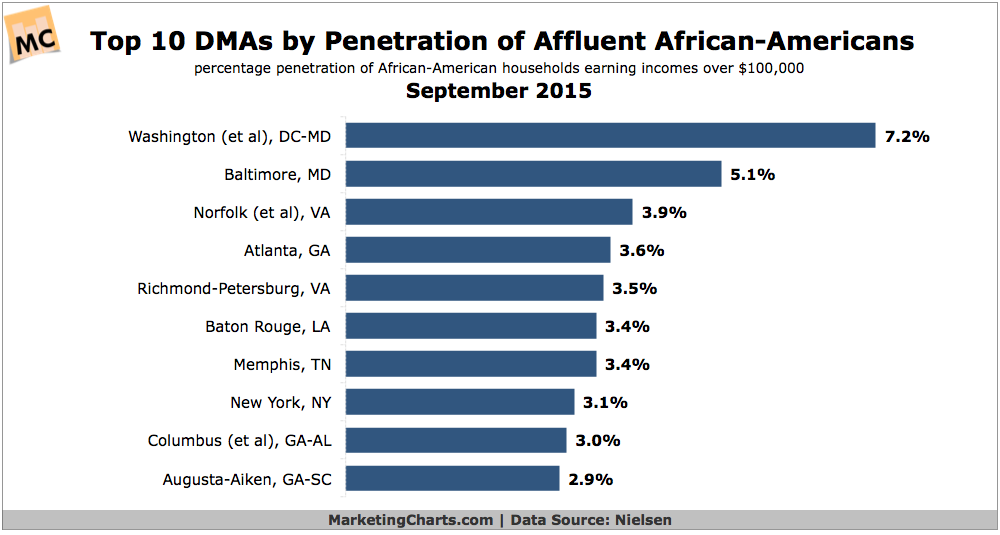
Read MoreTop 10 Metropolitan Areas By Percentage Of Affluent African Americans, September 2015 [CHART]
African-Americans are increasingly affluent, educated and diverse.
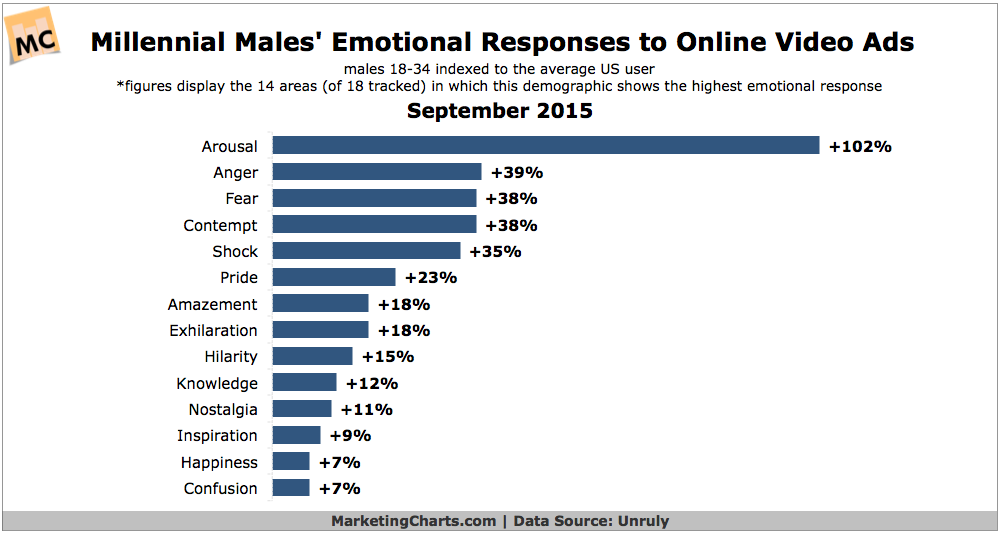
Read MoreMale Millennials' Emotional Responses To Video Ads, September 2015 [CHART]
Who has the most emotional response to online video ads? Apparently it’s Millennial men.
Read More