Content Marketing
Average Monthly Spending On Mobile Games By Segment, February 2014 [CHART]
The smartphone gaming audience will see faster growth in 2014 and all the way through 2018.
Read MoreMillennial Content Sharing By Category & Channel, April-July 2014 [CHART]
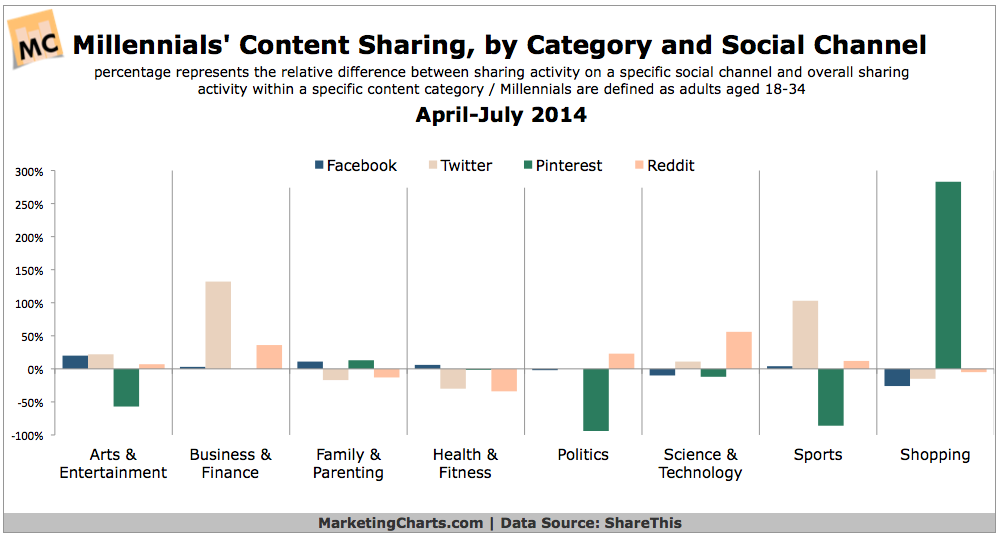
Millennials (18-34) are far more likely than the general population to share content on social networks and to click on shared content.
Read MoreThe Life Of A B2B Sales Representative [INFOGRAPHIC]

This infographic from Qvidian illustrates the life and struggles a B2B sales representatives face on the job.
Read More
Effect That Social TV Has On TV Show Follower Growth, September 2014 [CHART]
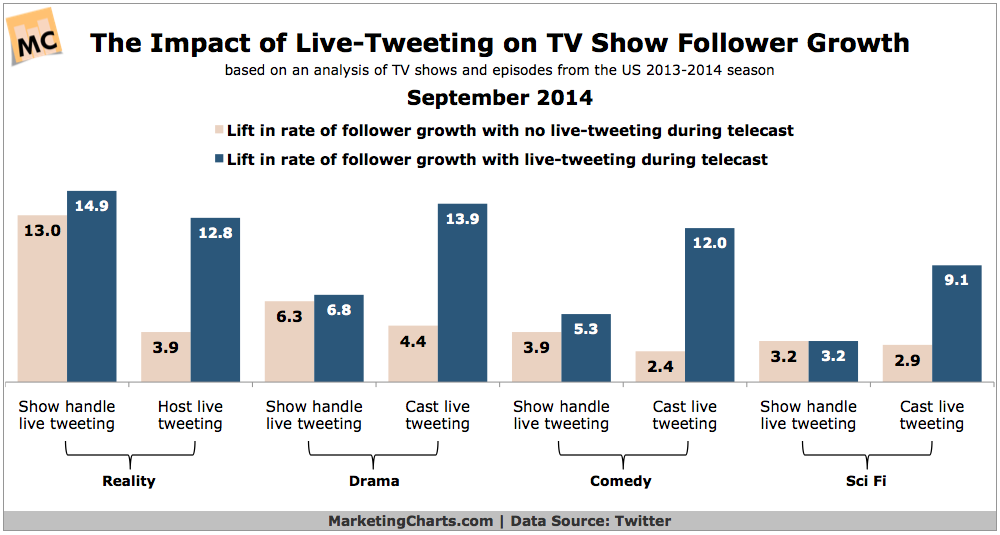
TV shows that live-tweet have a better follower growth rate than those that don’t.
Read MoreThe Internet Spec Sheet [INFOGRAPHIC]
Let this infographic by SumAll and Buffr (via AdWeek) server as your cheat sheet to the length of stuff online.
Read MoreShare Of TV Multitasking Time, October 2014 [CHART]
Some 51% of TV viewers multitask every time or almost every time they watch TV, up from 36% last year.
Read MoreConsumer Magazines’ Revenue Sources, October 2014 [CHART]
The consumer magazine CEO survey finds that an estimated 44% share of revenues came from print ads last year.
Read MoreComparison Of B2C vs. B2B Content Marketing Trends, October 2014 [TABLE]
More B2B (86%) than B2C (77%) marketers are using content marketing this year.
Read MorePrimary Channels In Which Millennials Share Content, June 2014 [TABLE]
25% of US millennial internet users shared digital content via social, with an average four shares per week.
Read More