Content Marketing
Online Video Viewers Who Abandon Videos Before They Start By Format, 2012 [CHART]
18% of online video viewers worldwide had abandoned live videos before they began, compared to only 6% for short-form video-on-demand.
Read MoreOscars 2013 Social TV Chatter On Facebook [INFOGRAPHIC]
This infographic by Facebook illustrates some of the Social Television chatter that occurred during the Oscars broadcast.
Read MoreVideo Engagement: Facebook Uploads vs. YouTube Links, January 2013 [CHART]
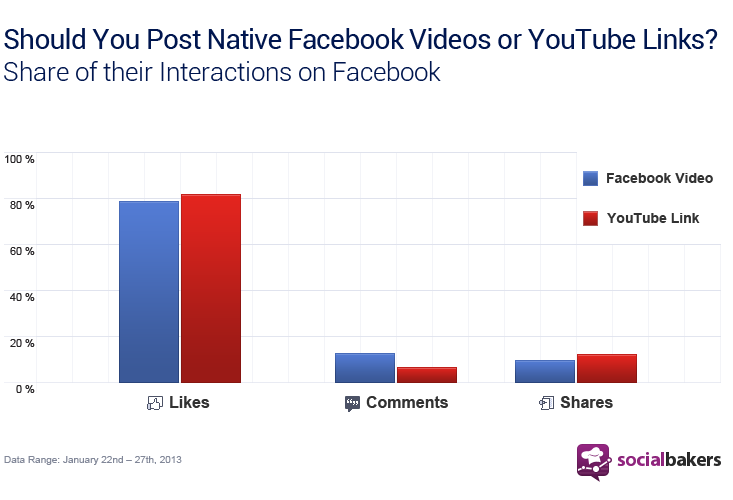
Facebook videos achieved a 40% higher Engagement Rate (0,25%) than YouTube links (0,151%) in the studied period.
Read MoreGetting Facebook Shares [INFOGRAPHIC]
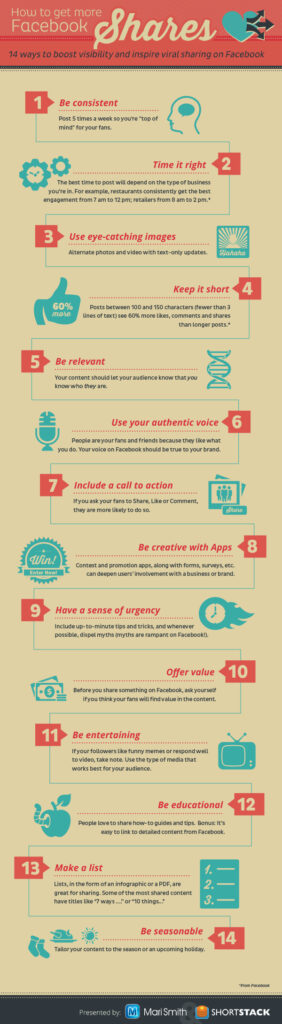
This infographic by Mari Smith illustrates fourteen tactics to inspire people to share your content on Facebook.
Read MoreHow Top Brands Cross-Post Instagram Photos To Facebook & Twitter [INFOGRAPHIC]
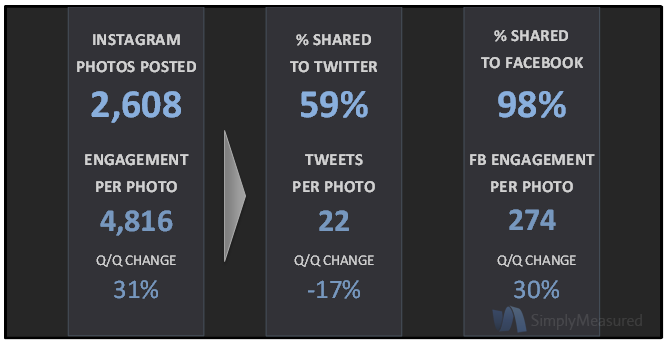
Of the 2,608 photos the top 100 brands shared in the past quarter, 98 percent were posted to Facebook.
Read MoreTop Brands' Use Of Instagram Filters [CHART]
In November, roughly one-half of the brands on Instagram used filters, but that number has reduced over time.
Read MoreTypes Of Health Information Sought Online By Generation & Gender, September 2012 [TABLE]
16% of internet users said they had searched for information on a drug they had seen advertised.
Read MorePreferences For Subscription vs. Ad-Supported Streaming Content By Device, November 2012 [CHART]

Most consumers still prefer free, ad-supported content though those with connected TVs are more likely to like the ad-free subscription model.
Read MoreHouse Of Cards Twitter Chatter [CHART]
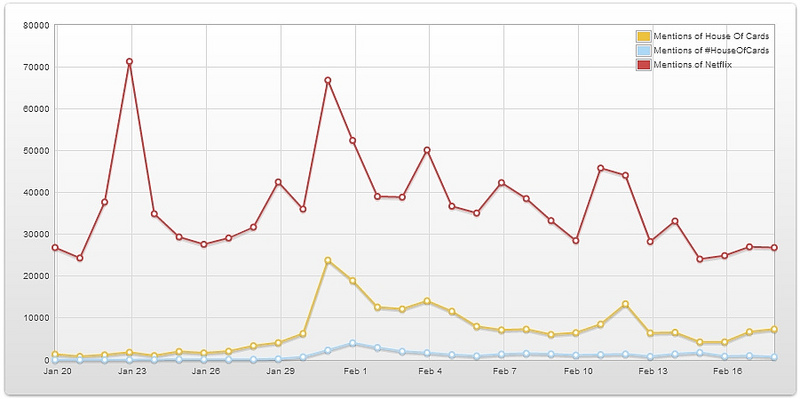
Not surprisingly, the use of a #HouseOfCards hashtag is very low, considering Netflix has never promoted its use.
Read More10% Of Netflix Subscribers Have Streamed House Of Cards

About 10 percent had watched House of Cards during the first few weeks it was available.
Read More