Content Marketing
Cable TV Subscriber Attitudes, September 2013 [TABLE]
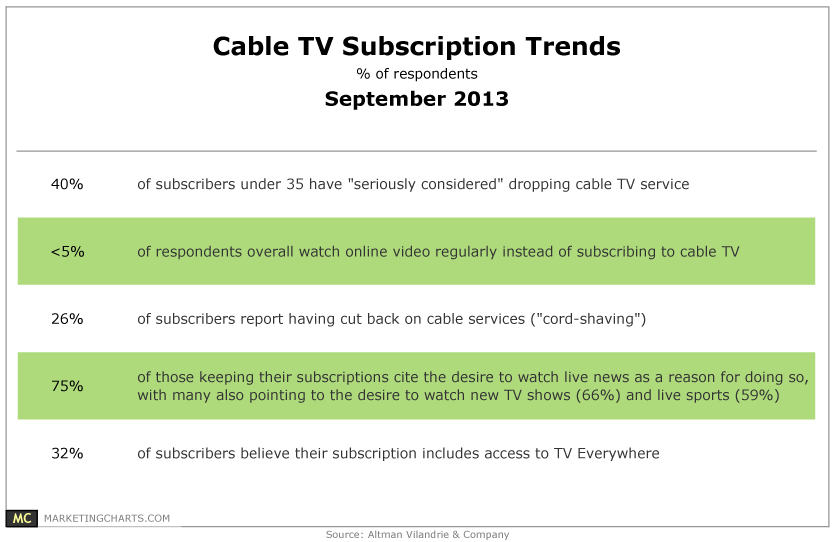
The number of TV cord-cutters has been rising more quickly than expected of late, but represented only about 1% of pay-TV subscribers last year.
Read MoreTime Using Tablets By Activity, September 2013 [CHART]
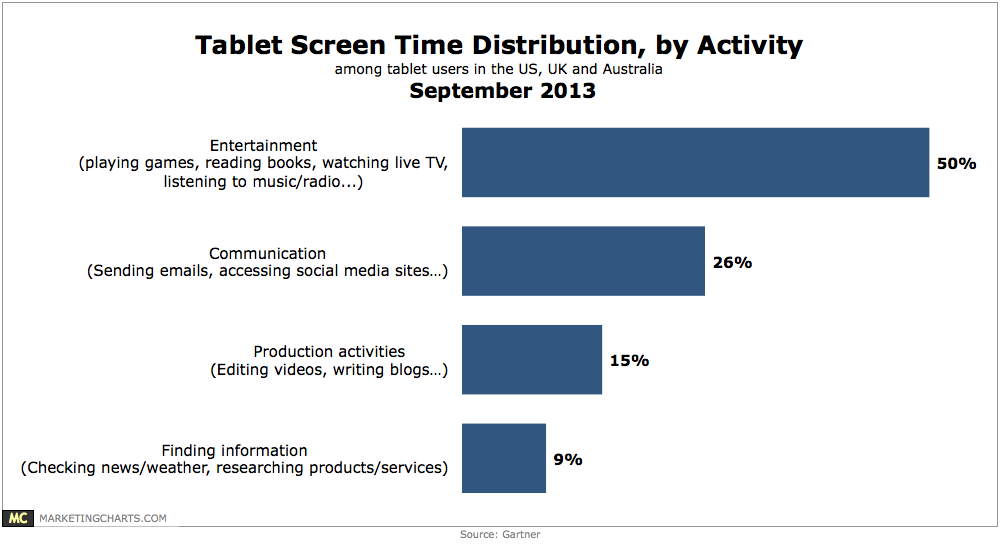
Tablet owners spend half of their device time with entertainment activities such as playing games, reading books, watching live TV or listening to music and radio.
Read MoreIT Buyers' Content Consumption, September 2013 [CHART]
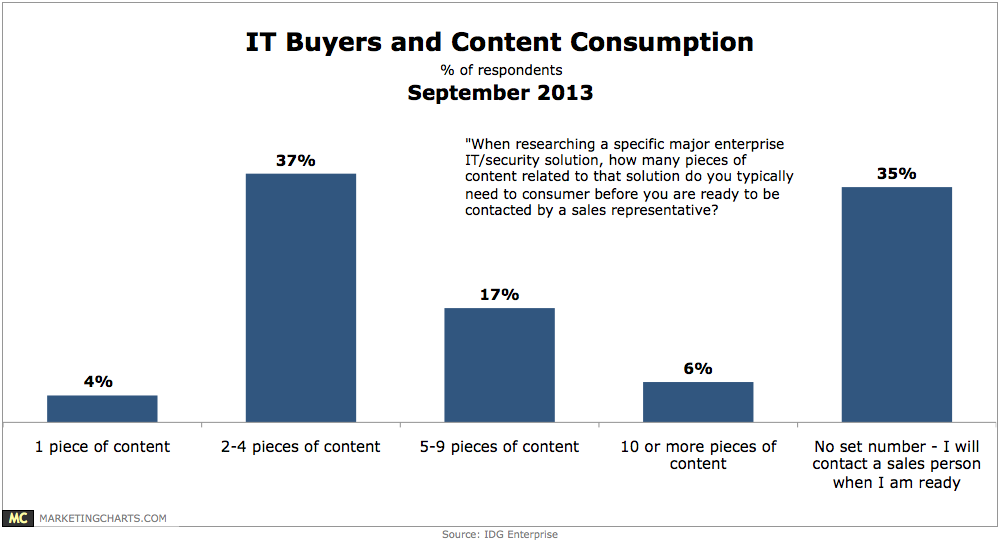
During the purchase process for major enterprise IT/security products and services, IT decision-makers download an average of 8 informational assets.
Read MoreB2B Marketing Tactics, 2012 & 2013 [TABLE]
Websites were the most uniformly employed technique, used by 85% of those polled.
Read MoreSelect Content Types Women Consume Online By Platform, March 2013 [TABLE]
The tablet was in especially heavy rotation among women for lifestyles, retail and parenting content.
Read MoreTop Types Of Content Shared On Social Media Sites, September 2013 [CHART]
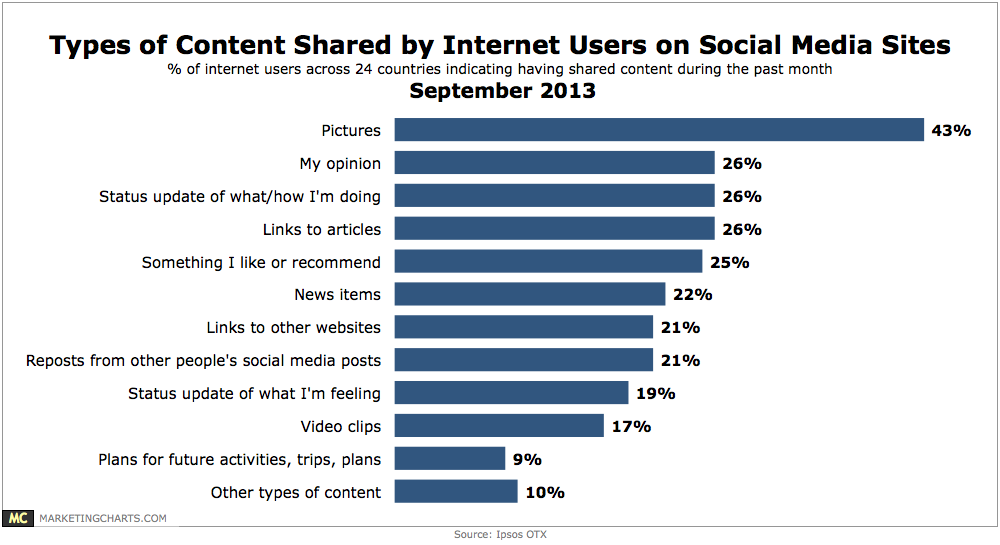
7 in 10 internet users across 24 countries say they’ve shared some type of content on social media sites in the past month.
Read MoreNative Advertising & Content Creation Spending Plans, September 2013 [CHART]
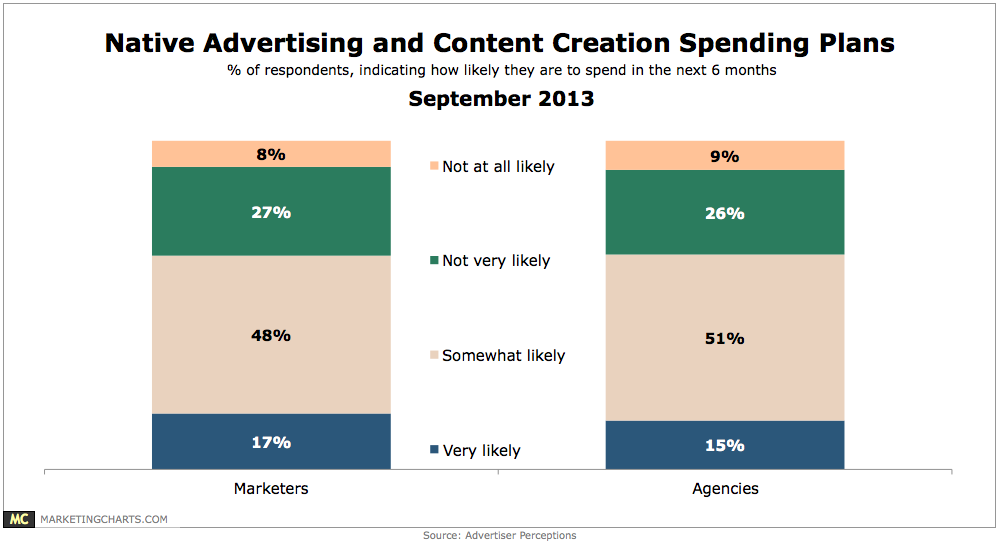
Roughly 2 in 3 marketers and agencies surveyed indicated that they are somewhat or very likely to spend on native ads and content creation in the next 6 months.
Read MoreMost Expensive Video Games [INFOGRAPHIC]
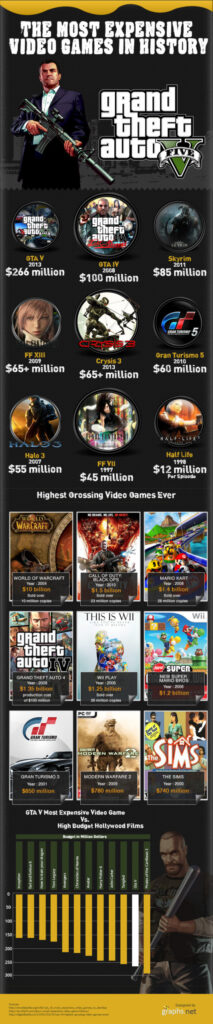
This infographic by Graphs.net illustrates the most expensively produced video games and comes hot on the heels of news that Grand Theft Auto V, the most expensive game at $266 million, took a mere three days to top $1 billion in gross sales.
Read More
Brands' Use Of Facebook Ads To Increase Post Reach, September 2013 [CHART]
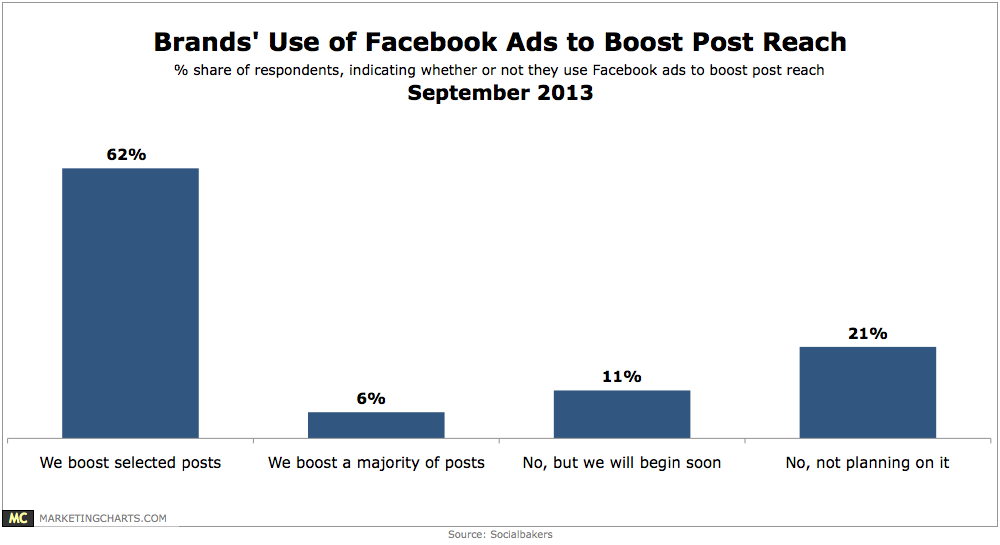
Roughly 8 in 10 marketers plan to increase their social media spending over the next 3 years, the majority of whom expect to hike their spending by upwards of 25%.
Read More