Consumer Spending
The COVID-19 Pandemic Is Changing Shopping Behavior
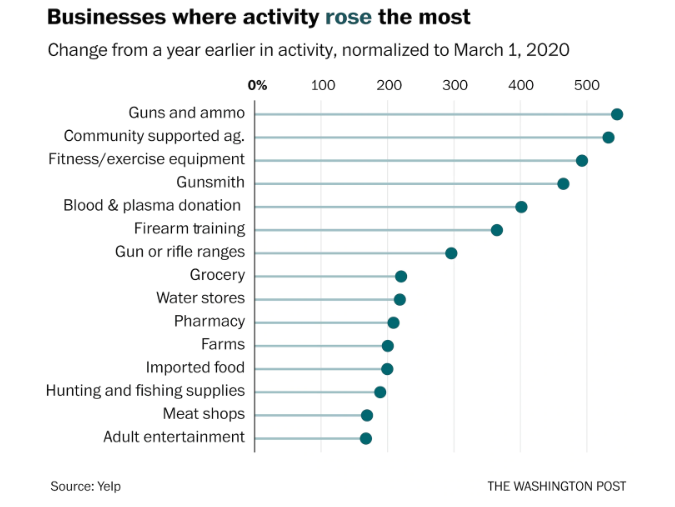
Yelp data helps illustrates how the coronavirus is effecting various types of retail businesses either positively or negatively.
Read MoreCOVID-19 Driving Buy Online, Pickup In Store Behavior
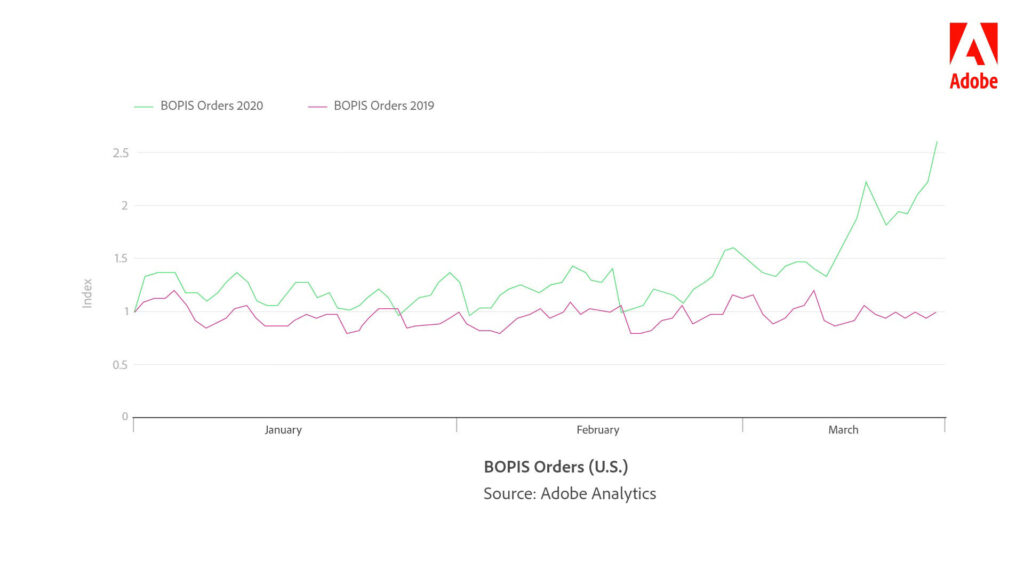
Findings from the Adobe Digital Economy Index show, that the COVID-19 pandemic is driving consumers to buy online and pickup in-store.
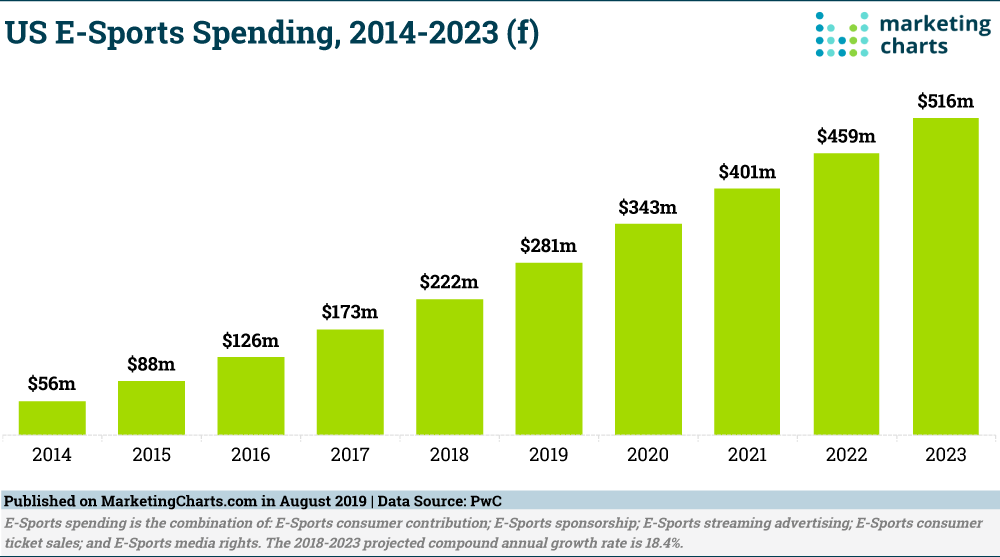
Read MoreeSports Spending, 2014-2023 [CHART]
The business of video gaming is big and getting bigger, with a majority of US adults playing this year. A burgeoning area of the gaming industry is much like with regular sports: when people aren’t playing them, they like to watch others play.
Read MoreHalloween Stats & Sales [INFOGRAPHIC]
This infographic from The Shelf illustrates the frightening amount of money we spend on Halloween.
Read MoreGeneration X Household Budget [TABLE]
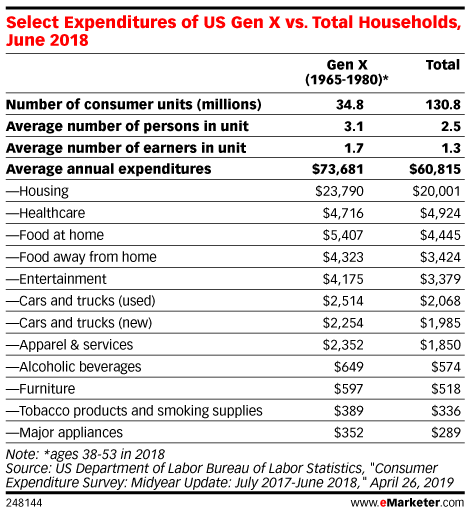
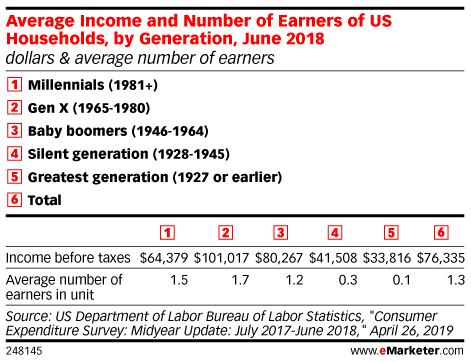
At 65 million strong, Gen X—those born between 1965 and 1980 per our definition—is smaller in size than the boomer and millennial generations, but their average pretax household income is about $101,000 annually, nearly $25,000 more than the average for all US households.
Read MoreAverage Household Income By Generation [TABLE]
The ‘forgotten’ Generation X makes and spends more than other generations, but they’re also financially stressed.
Read MoreConsumer Spending By Generation [CHART]
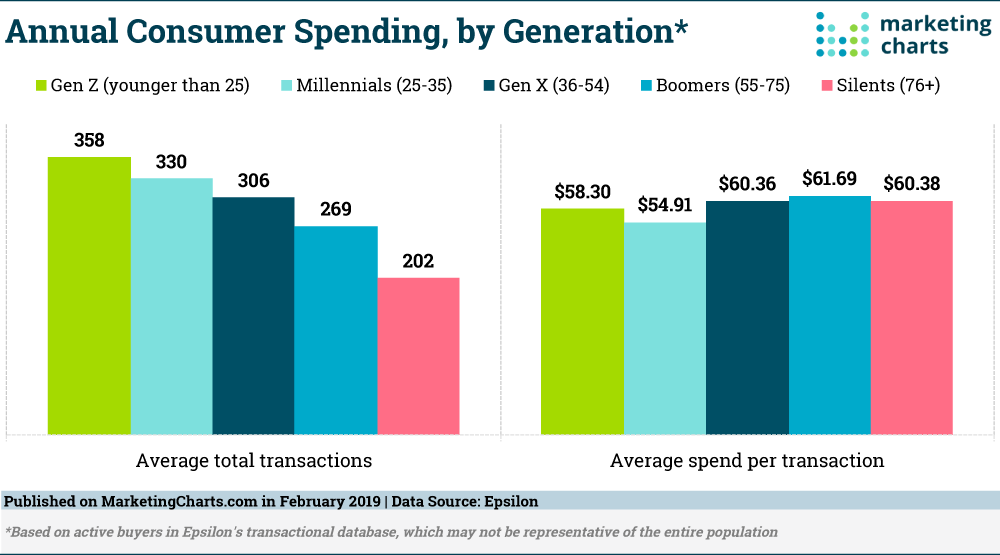
Marketers put a lot of time, attention, and valuable marketing dollars on targeting Millennials and Gen Z. There are some arguments to be made about how warranted that effort is, given that there’s a generation that has much more money to spend: Baby Boomers, according to Epsilon’s latest report on cross-generational marketing.
Read MoreValentine's Day Spending, 2009-2019 [CHART]
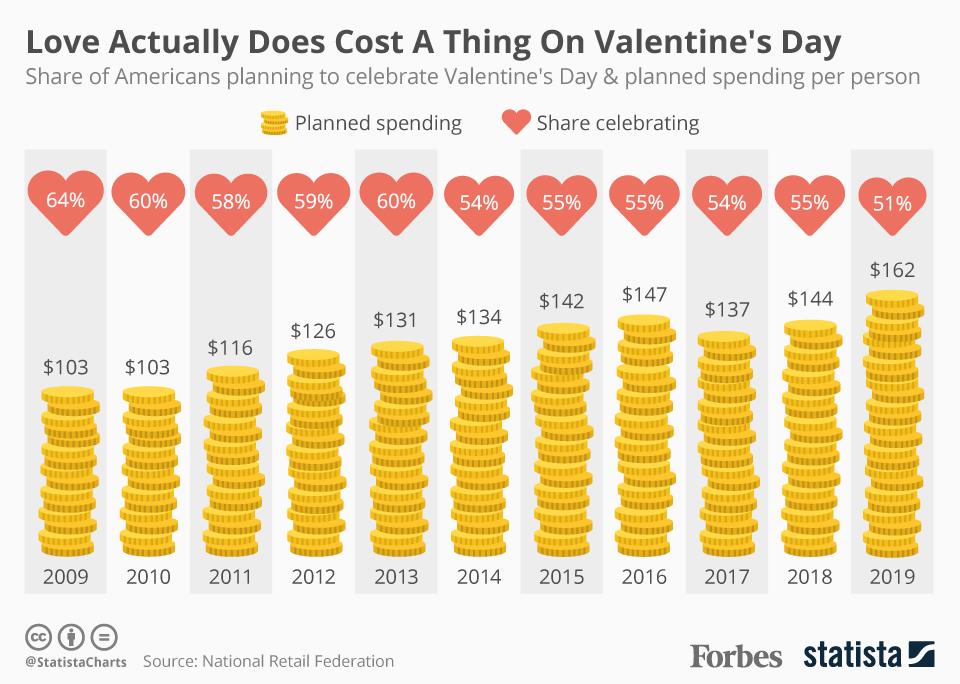
Total Valentine’s Day spending across the U.S. is expected to be $20.7 billion this year, an increase of 6% over 2018′s $19.6 billion, according to the National Retail Federation.
Read MoreConsumer Spending By Generation [TABLE]
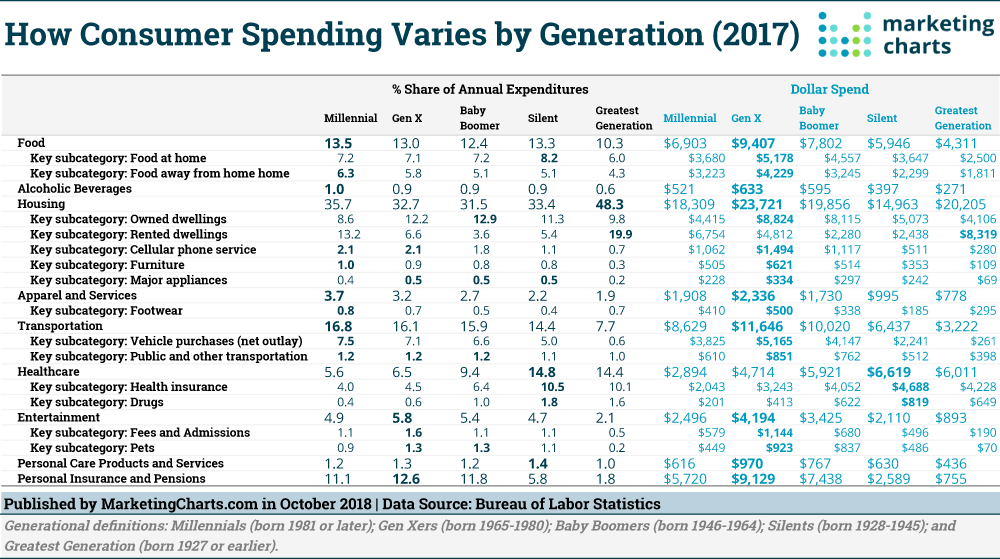
Gen Xers had the highest average income before taxes last year, of roughly $95k, according to the latest annual Consumer Expenditure Survey from the Bureau of Labor Statistics, and they averaged the most spending, too.
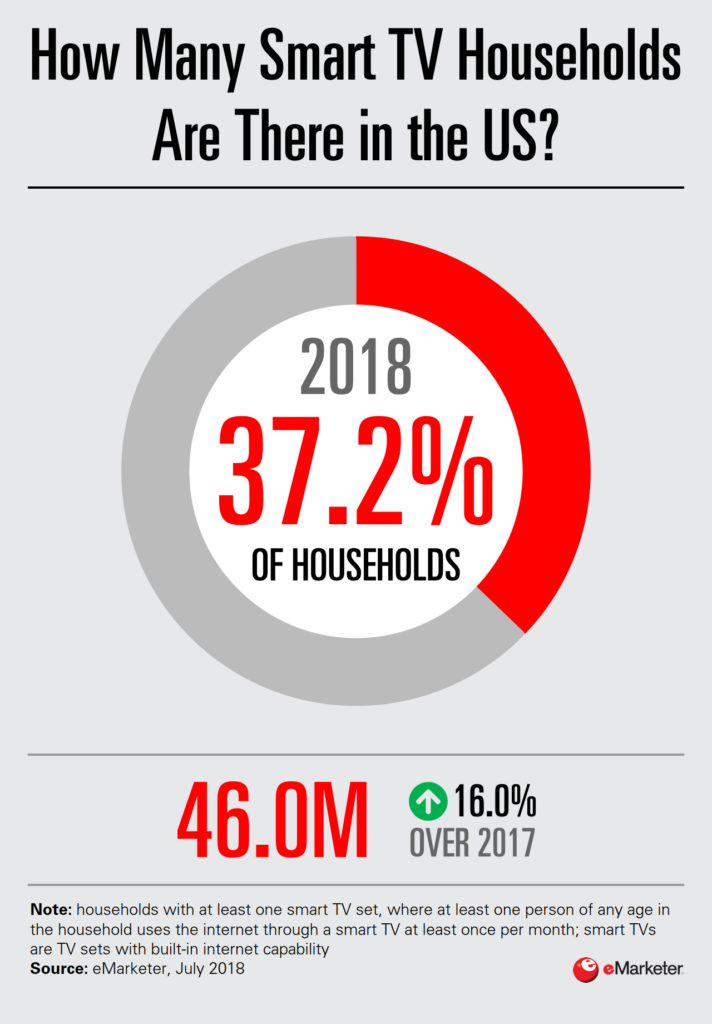
Read MoreUS Smart TV Ownership [CHART]
The increased usage of streaming video services like Netflix or Amazon Prime Video combined with a lower barrier of entry has led to a rapid uptake in smart TV ownership.
Read More