Consumer Spending
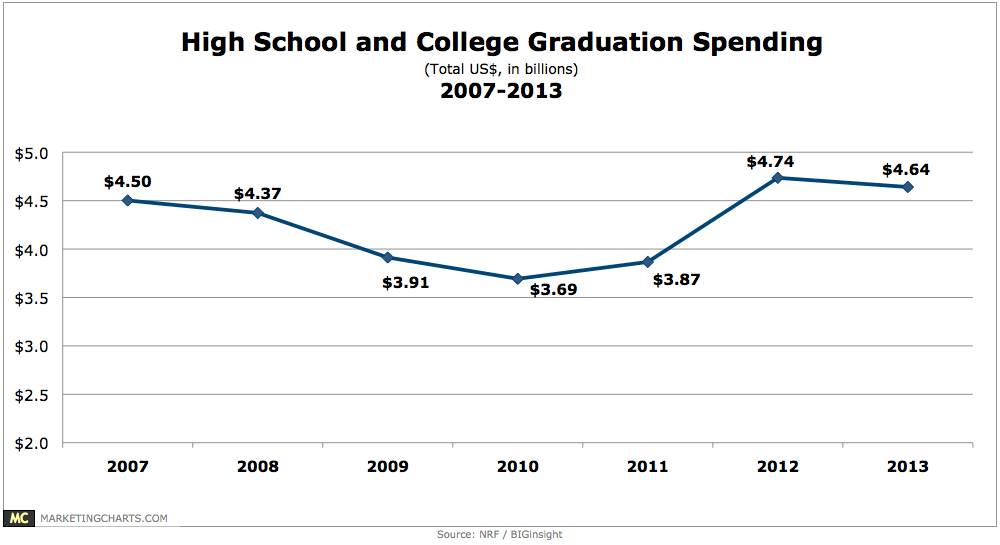
High School & College Graduation Spending, 2007-2013 [CHART]
Graduation season is here, and Americans will shell out $4.6 billion to reward high school and college seniors.
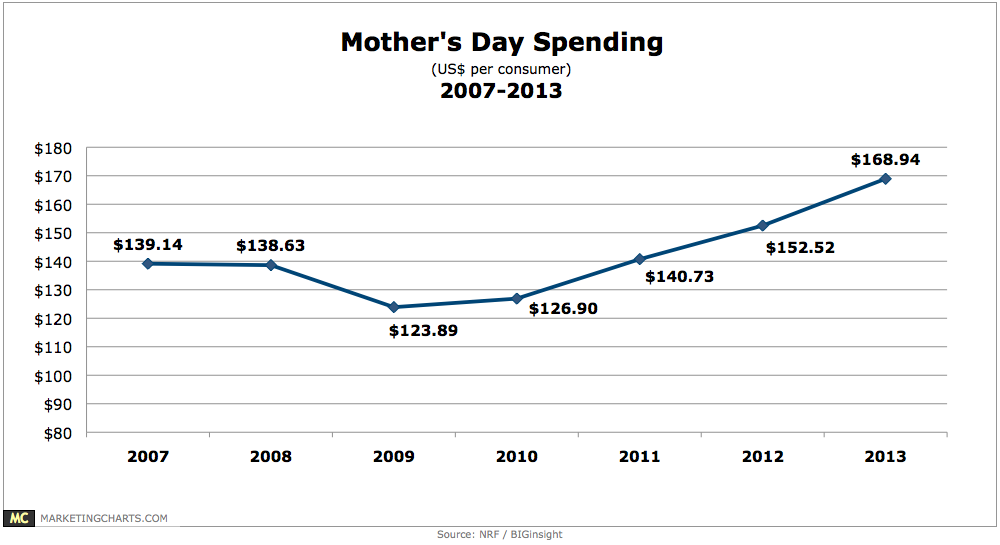
Read MoreMother’s Day Spending, 2007-2013 [CHART]
The average consumer will spend 11% more on Mother’s Day (Sunday, May 12), for an average of $169, with total spending expected to reach $20.7 billion.
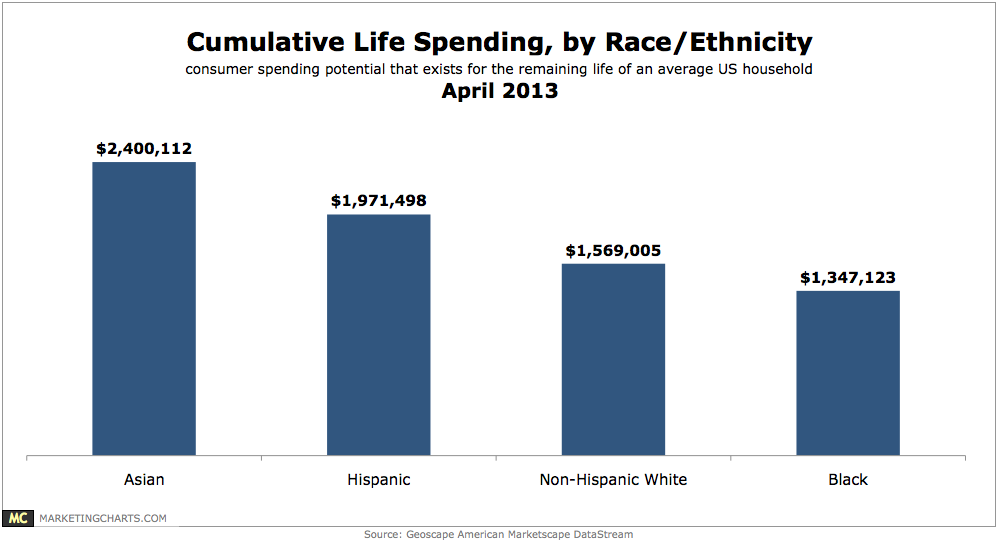
Read MoreCumulative Life Spending By Race/Ethnicity, April 2013 [CHART]
Asian and Hispanic households will outspend non-Hispanic White households in their lifetimes.
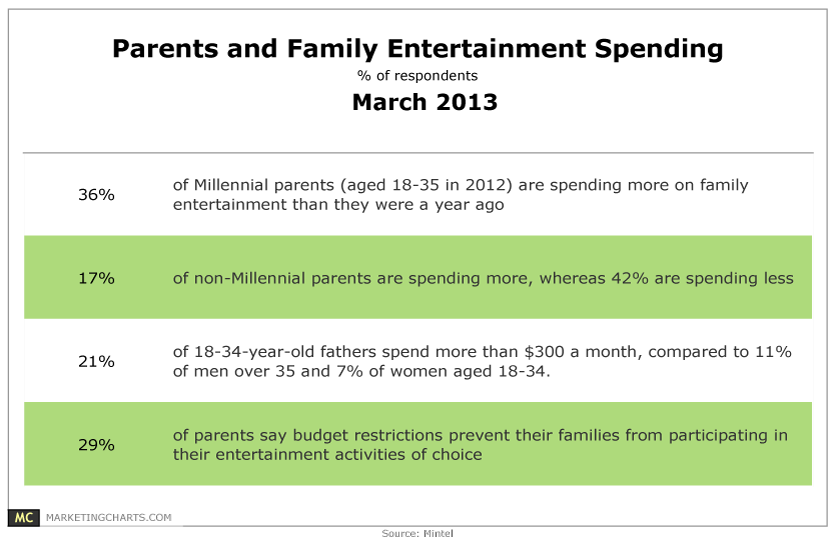
Read MoreParents & Family Entertainment Spending, March 2013 [TABLE]
Millennial (18-35 in 2012) parents are twice as likely as non-Millennial parents to say they’re spending more on family entertainment than they were a year ago (36% vs. 17%).
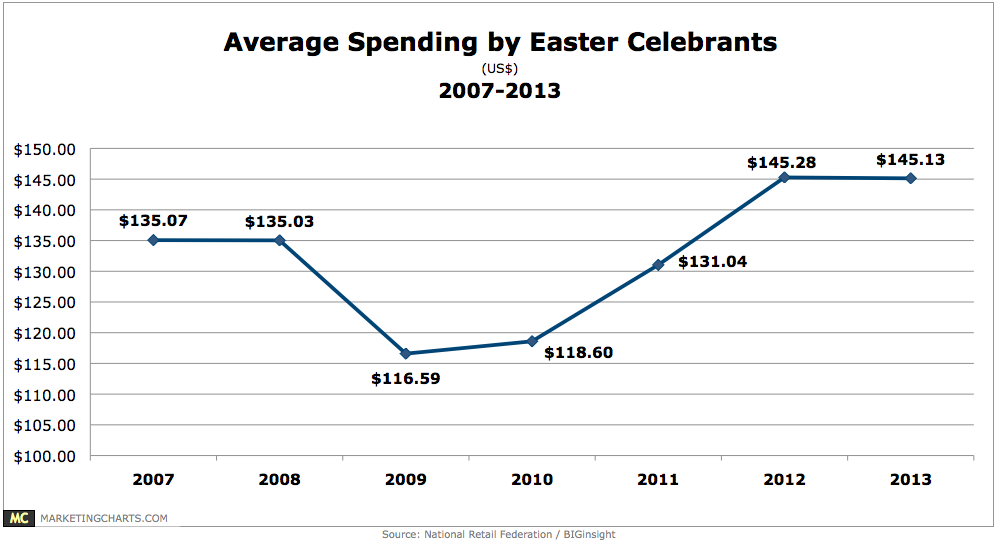
Read MoreAverage Easter Spending, 2007-2013 [CHART]
The average Easter celebrant is expected to spend $145.13 on items ranging from candy to clothes for this year’s Easter holiday, basically unchanged from last year’s $145.28.
Read MoreSt. Patrick’s Day Spending, 2007-2013 [CHART]
Total consumer spending on St. Patrick’s Day (Sunday, March 17) will grow by 3.7% this year to slightly exceed $4.7 billion.
Read MoreUS Consumer Spending, 2008-2012 [CHART]
This year’s average self-reported daily spending was $74, up from $65 in September of last year and $59 the year before that.
Read MoreMost Popular Planned Holiday Gift Categories, October 2012 [CHART]
Just as in 2011, clothing and gift cards lead as the most popular planned gift choices this holiday season.
Read MoreAmerican Consumer Holiday Spending Intentions, 2011 vs. 2012 [CHART]
1 in 10 consumers intend to spend more this holiday season than last.
Read MoreThe Halloween Economy [INFOGRAPHIC]
This infographic from WiseBread looked into Halloween spending, and found that from 2007 to 2012, Americans shelled out an average of $28.65 on costumes.
Read More