Technographics
US Technology Adoption By Platform, 2010-2016 [CHART]
The overall online penetration rate in the U.S. has stabilized at 79 percent.
Read More92% Of Consumers Share Mobile Video Clips [PIC]
63 percent of digital video screening on mobile phones does not happen on-the-go, but rather at home.
Read MoreAnticipated Smart TV Market Growth, January 2013 [TABLE]
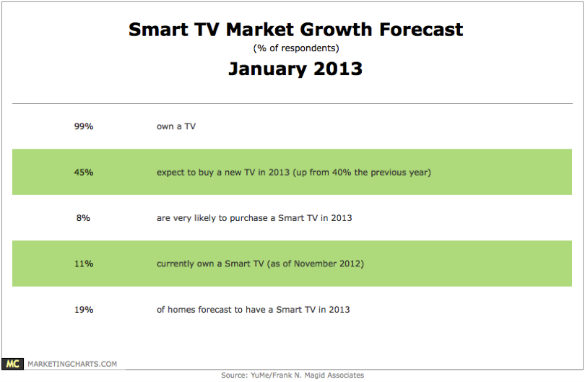
19% of homes will have a Smart TV this year.
Read MoreChristmas Day Smart Device Activations, 2012 [CHART]
17.4 million smart devices (iOS and Android) were activated worldwide on Christmas Day, more than 4 times the baseline average of 4 million from the first 20 days of the month.
Read More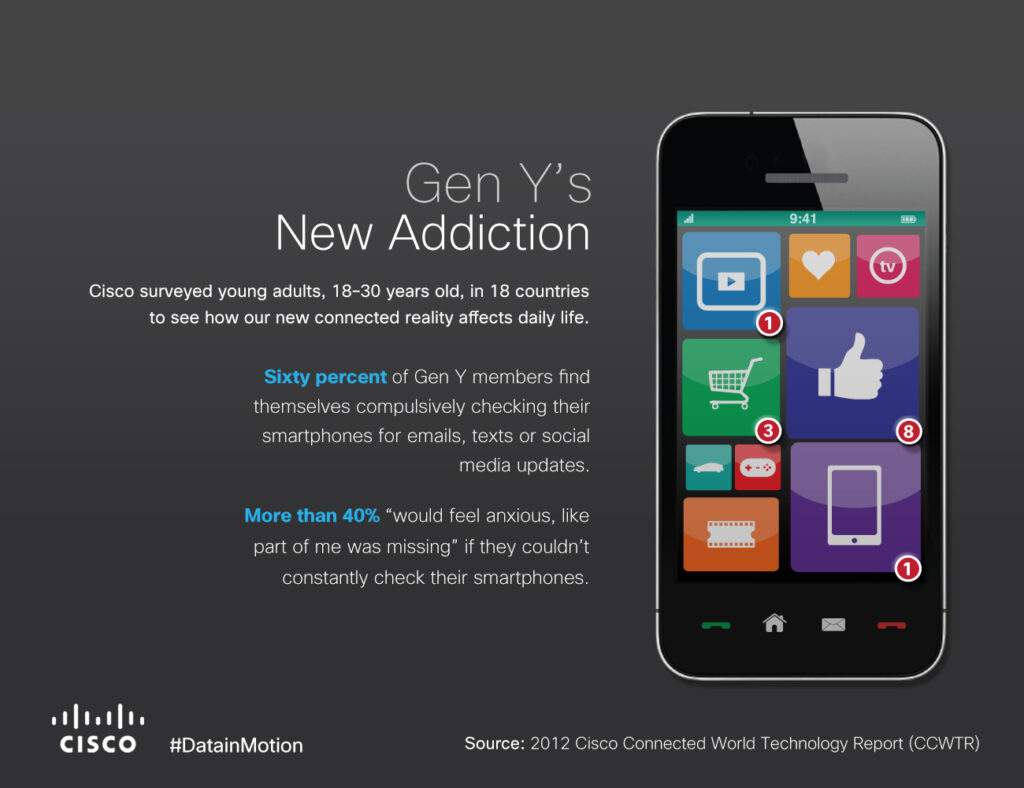
Millennials' Views On Technology, Privacy & Identity [INTERACTIVE INFOGRAPHIC]
An interactive infographic by Cicsco that takes a look at Millennials’ views on technology, privacy and identity.
Read MoreExpected Change In Connected TV Viewing Behavior By Device, November 2012 [CHART]
A nearly equal percentage of respondents expected to increase their connected TV viewing on consoles, Blu-ray players and internet video devices.
Read MoreInterest In Connecting TVs To The Internet By Device, November 2012 [CHART]
TVs connected to the internet either directly or through an external device are expected to reach 42% of US households by the end of next year.
Read MoreNew TV Purchase Intent Patterns, 2002-2012 [TABLE]
45% of US consumers total said they planned to purchase a new television in the next year, the largest percentage of consumers in years to purchase new TVs or replace their old sets.
Read More