Consumer Attitudes
Consumer Attitudes Worldwide Toward Mobile Advertising, February 2013 [CHART]
This chart from Nielsen is a snapshot of consumer attitudes worldwide toward mobile advertising.
Read MoreSmall Business Owners' Attitudes Toward Marketing Targeted At Them, March 2012 [CHART]

Small business owners would likely be more inclined to open their wallets if the marketing aimed at them struck a chord—but it often does not.
Read MoreLatinos Identities, February 2013 [CHART]
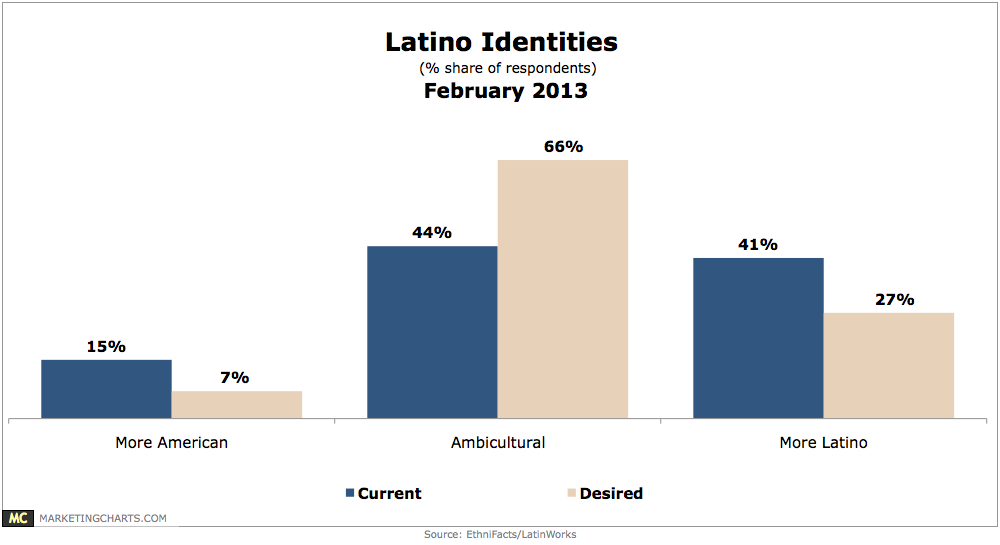
Latinos are increasingly aspiring to be equally Latino and equally American.
Read MoreAmericans' Most Popular Movie Genres [CHART]
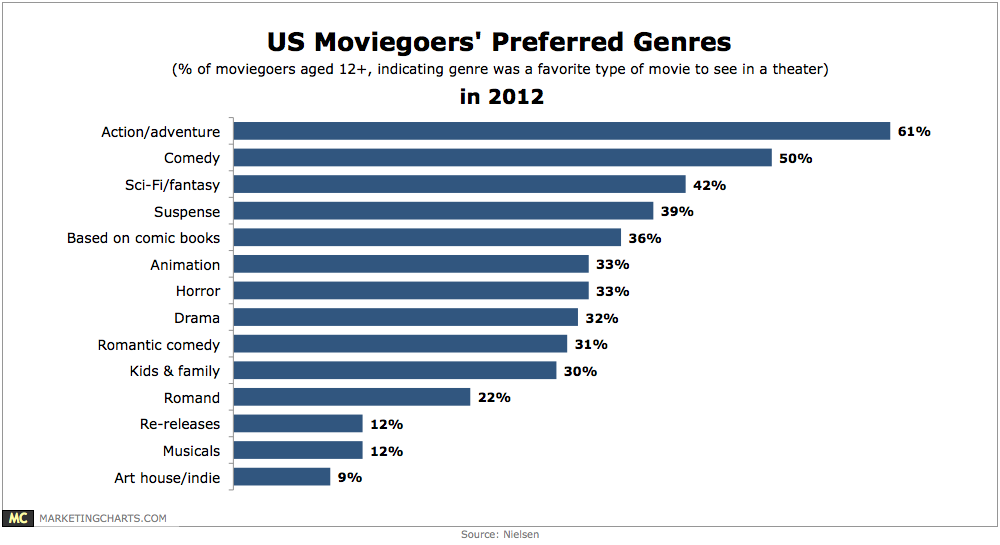
Asked the types of movies they like to see most in theaters, 61% of American moviegoers chose action and adventure flicks, with comedy (50%) rating as the second-most popular.
Read MorePreferences For Subscription vs. Ad-Supported Streaming Content By Device, November 2012 [CHART]

Most consumers still prefer free, ad-supported content though those with connected TVs are more likely to like the ad-free subscription model.
Read More10% Of Netflix Subscribers Have Streamed House Of Cards

About 10 percent had watched House of Cards during the first few weeks it was available.
Read MoreAmericans Researching Companies They May Deal With, February 2013 [CHART]
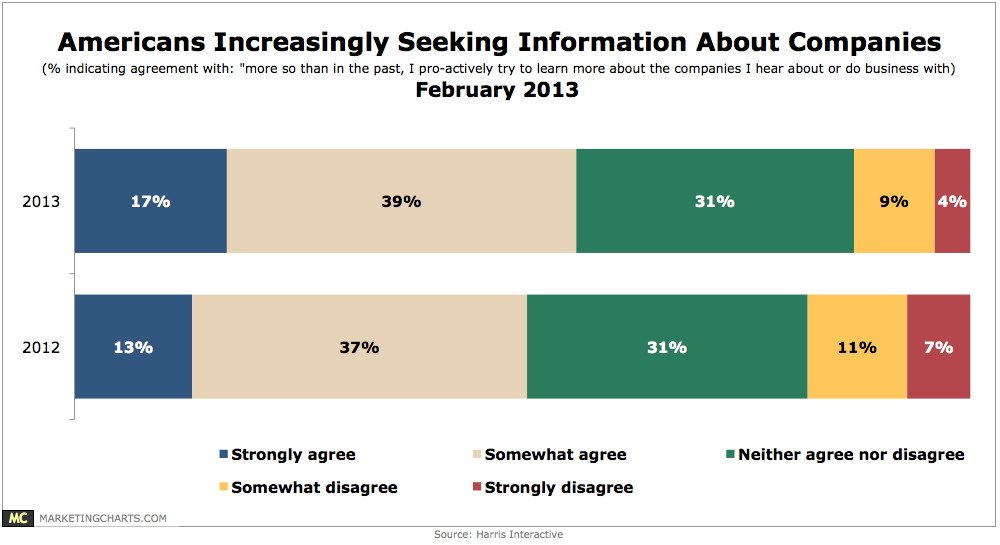
56% of Americans agree that now more than ever, they’re pro-actively trying to learn more about the companies they hear about or do business with.
Read MoreConsumer Attitudes About Online Monitoring By Generation, February 2013 [CHART]
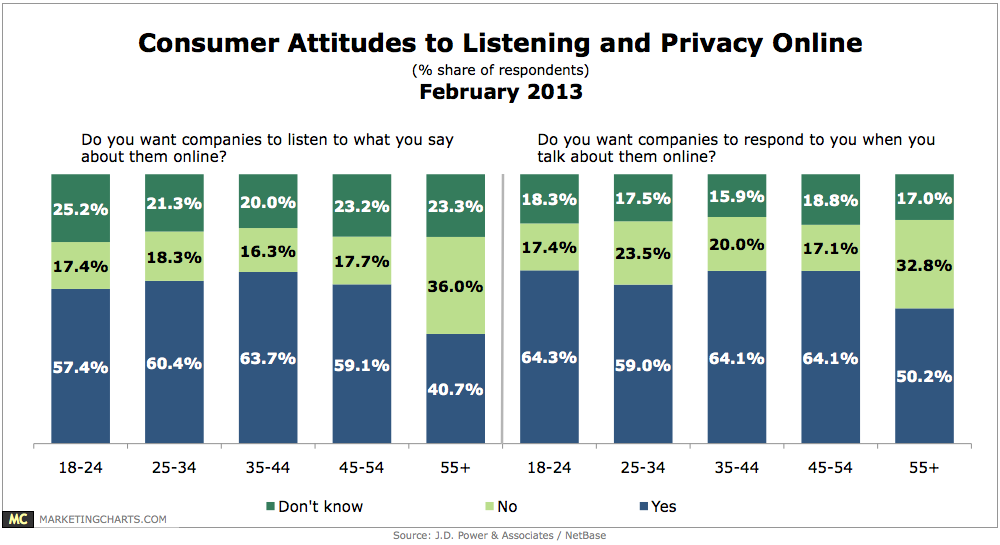
64% of 18-24-year-olds want companies to respond to them when they talk about them online.
Read MoreProduct Packaging Satisfaction, February 2013 [CHART]
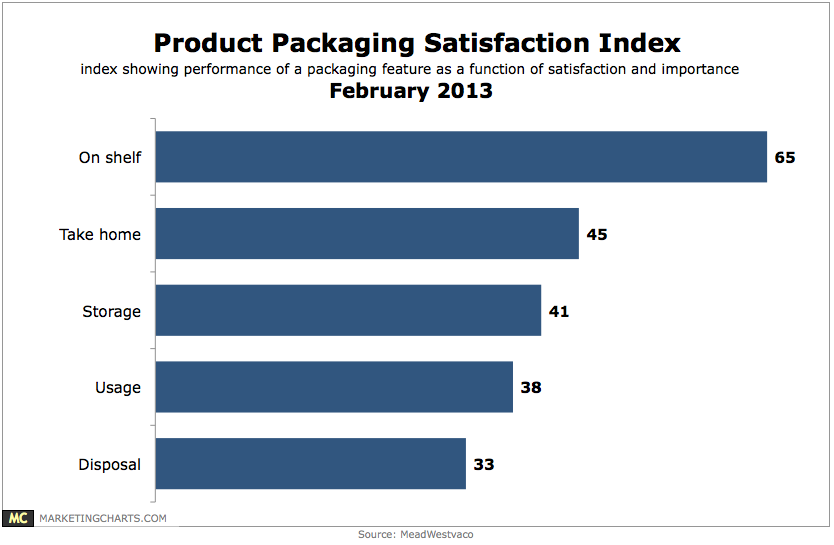
When it comes to overall product satisfaction, packaging matters to almost as many consumers as the brand itself.
Read MoreCitizen Perceptions Of The Value Of Online & Offline Media, February 2013 [CHART]
Connected consumers in the US place more monetary value on offline media activities or products than online ones ($1,600 per year vs. $1,132).
Read More