Consumer Attitudes
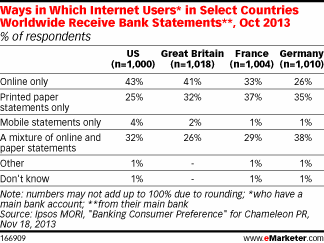
How People Get Their Bank Statements Worldwide, October 2013 [TABLE]
There was no clear uniformity among the countries in terms of customer preference for online or printed statements.
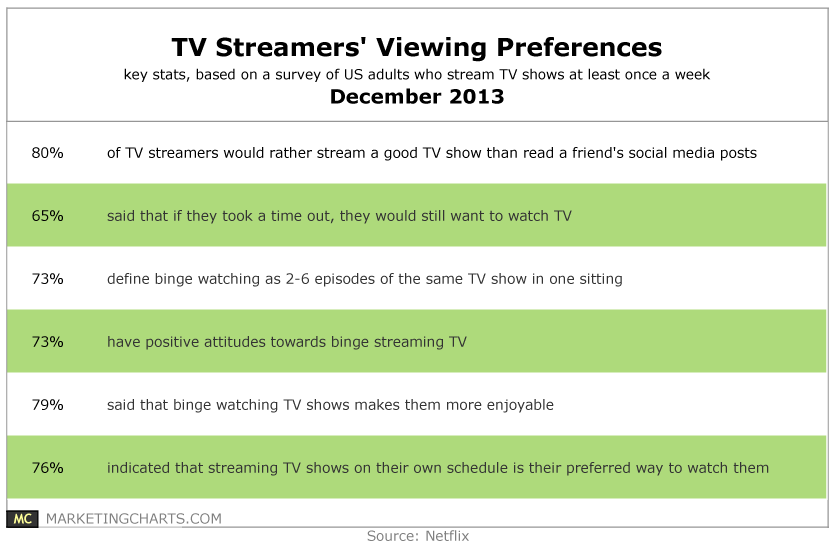
Read MoreTV Streamers' Viewing Preferences, December 2013 [TABLE]
Two-thirds of TV streamers said that if they took a digital time out, they’d still want to watch TV.
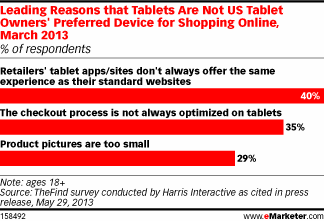
Read MoreTop Reasons Tablets Are Not A Preferred Online Shopping Device, March 2013 [CHART]
The tablet checkout process has also been a hindrance to greater eCommerce conversion.
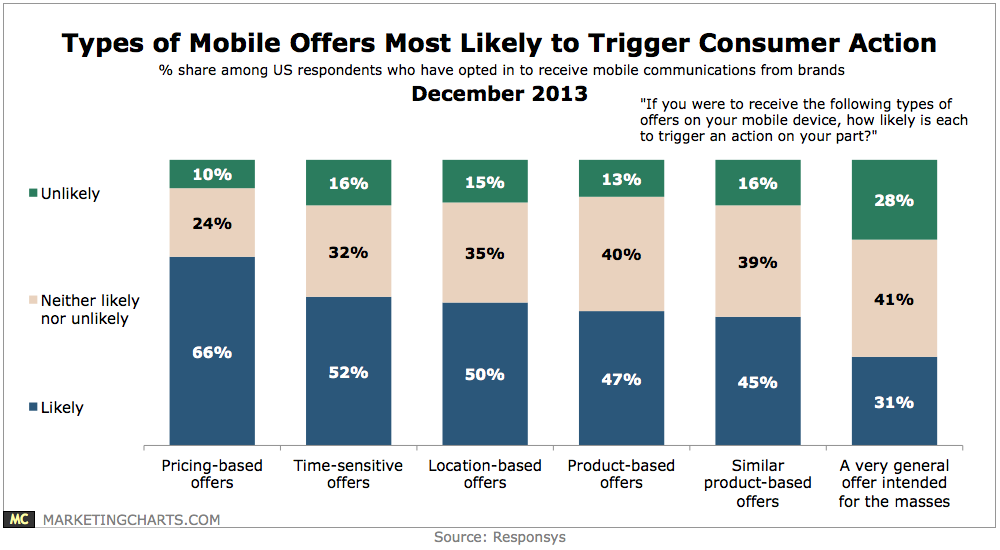
Read MoreMobile Offers Most Likely To Trigger Consumer Action, December 2013 [CHART]
4 in 10 respondents to a recent survey from GE Capital Retail Bank indicated that they would shop more at a retailer if it delivered them offers via mobile.
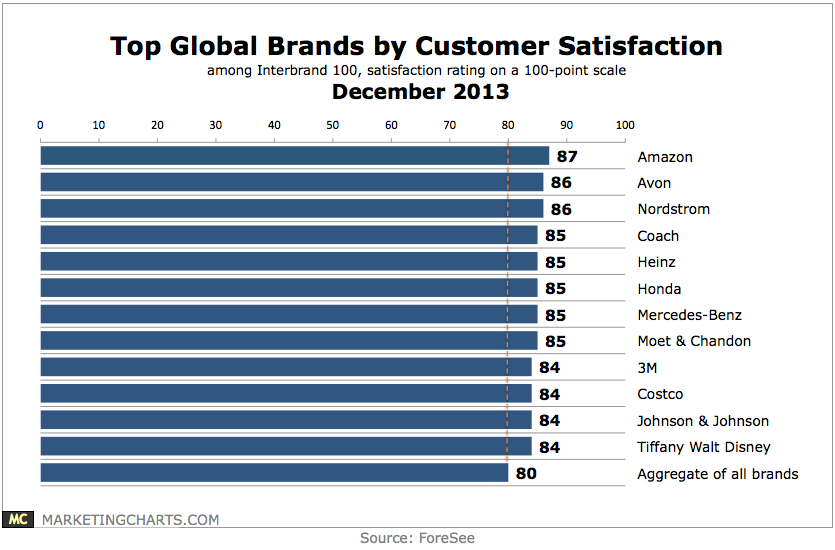
Read MoreTop Global Brands By Customer Satisfaction, December 2013 [CHART]
The average customer satisfaction with the top brands is 80 on a 100-point scale, with 68 of the brands scoring an 80 or above, considered by ForeSee to be the threshold of excellence.
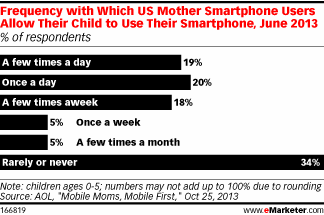
Read MoreFrequency With Which US Mothers Occupy Their Children With Smart Phones, June 2013 [CHART]
More than one-third reported rarely or never allowing their children to use their smartphones.
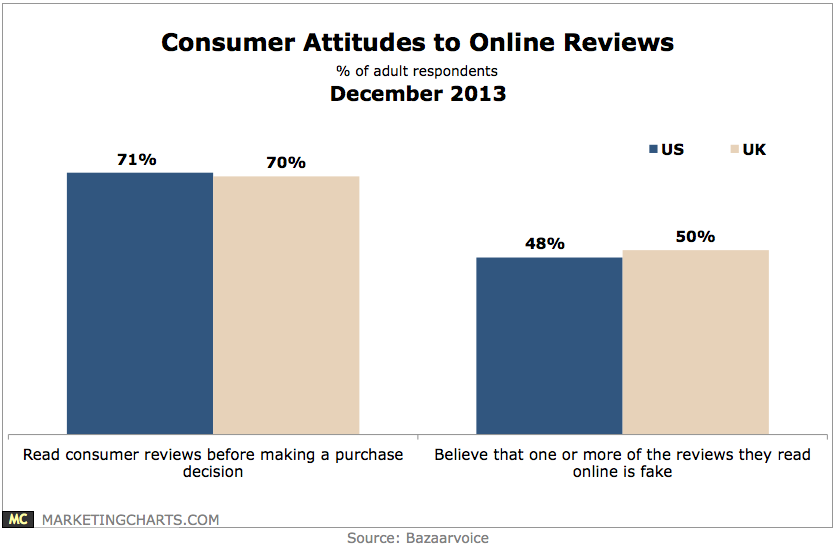
Read MoreConsumer Attitudes Toward Online Reviews, December 2013 [CHART]
7 in 10 adult consumers in the US and UK read consumer reviews before making purchase decisions.
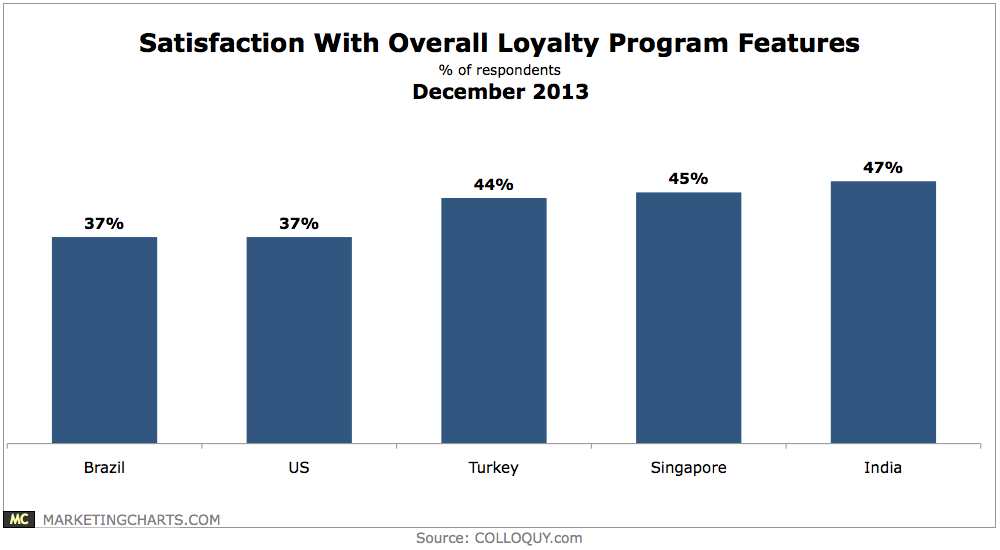
Read MoreSatisfaction Loyalty Program Features, December 2013 [CHART]
Fewer than half of the respondents in Brazil, India, Turkey and Singapore voiced their satisfaction with loyalty program benefits.
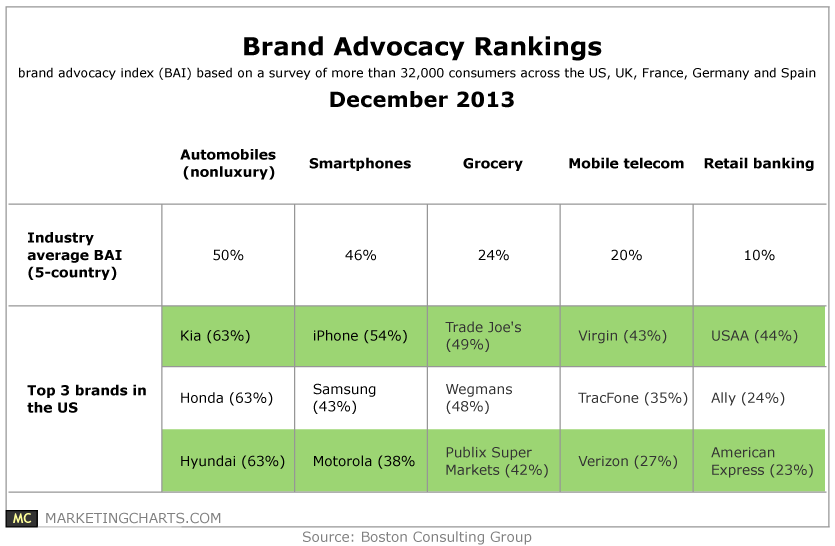
Read MoreBrand Advocacy Rankings, December 2013 [TABLE]
Among the sample of brands studied, the average difference between the top-line growth of the highest- and lowest-scoring brands was 27% points.
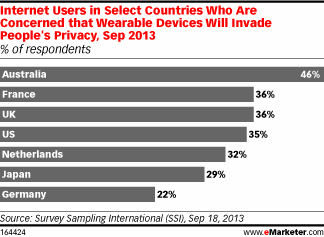
Read MorePrivacy Concerns Over Wearable Computers, September 2013 [CHART]
On average, around one-third of internet users in select countries were worried that wearable devices would invade people’s privacy.
Read More