Consumer Attitudes
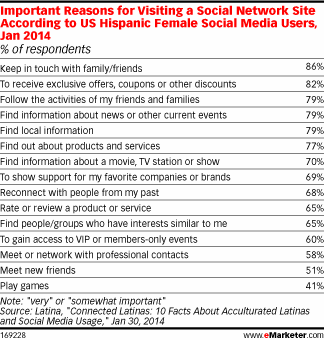
Top Reasons Latinas Visit Social Network Sites, January 2014 [TABLE]
More than eight in 10 Hispanic females said keeping in touch with family/friends was an important reason for using the site.
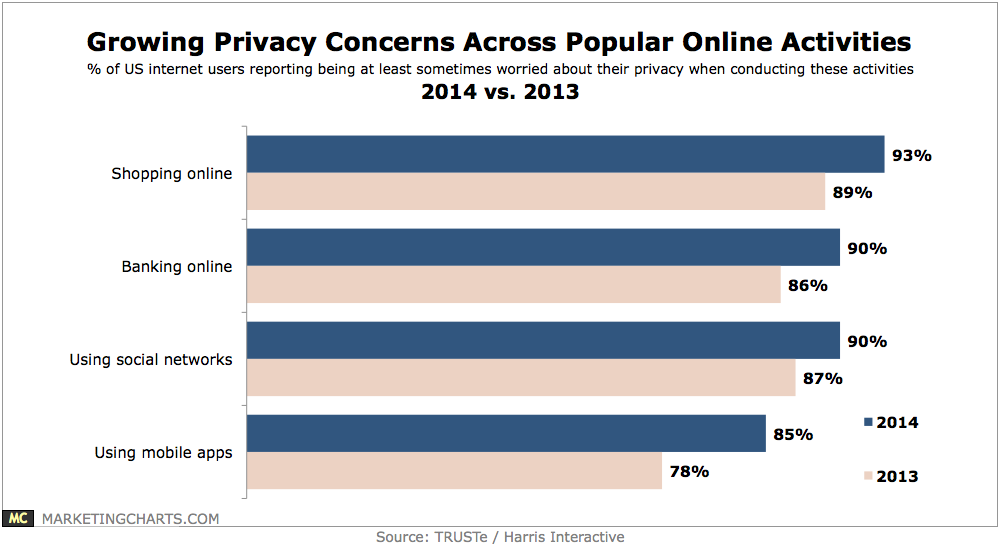
Read MoreGrowing Privacy Concerns Across Popular Online Activities, 2013 vs 2014 [CHART]
92% of American internet users report worrying about their privacy online at least sometimes, a figure that has remained consistent over the past couple of years.
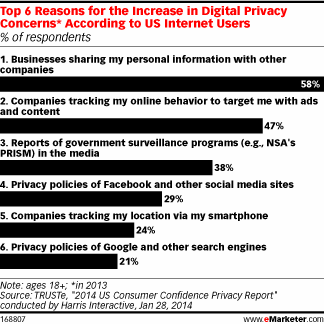
Read MoreTop Reasons People Are Concerned About Online Privacy [CHART]
The TRUSTe findings suggested that even post-Snowden, internet users were more concerned about commercial usage of their data than they were about government monitoring.
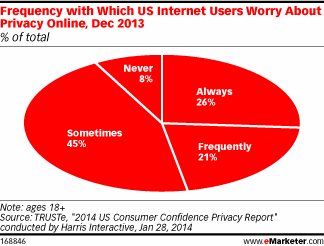
Read MoreFrequency With Which American Internet Users Worry About Online Privacy, December 2013 [CHART]
92% of US internet users reported worrying about their privacy online, up slightly from 89% in January 2013.
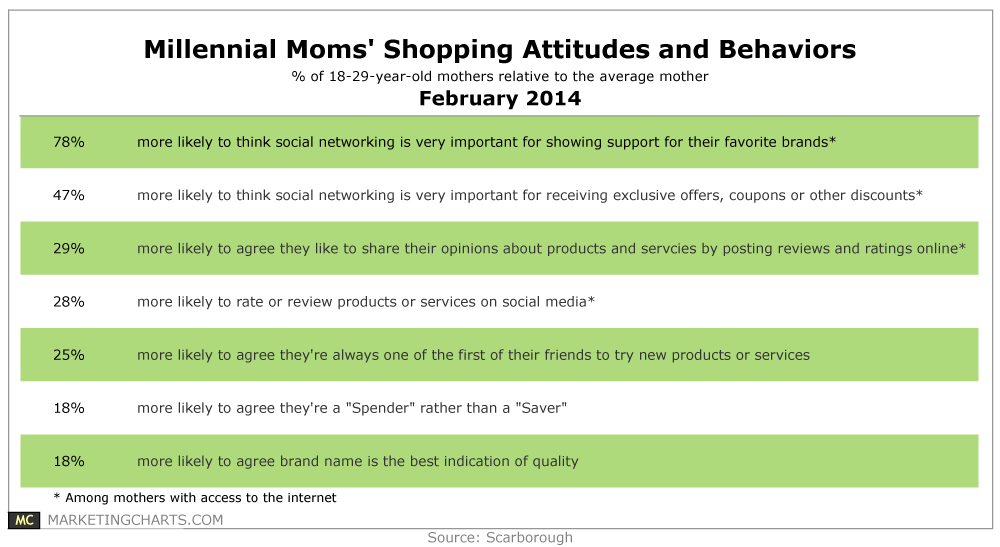
Read MoreMillennial Moms’ Shopping Attitudes & Behaviors, February 2014 [TABLE]
2 in 3 Millennial mothers (aged 18-29 with kids under the age of 18) have made a purchase online in the past 12 months, most commonly clothing or accessories (40%), books (28%) and toys or games (23%).
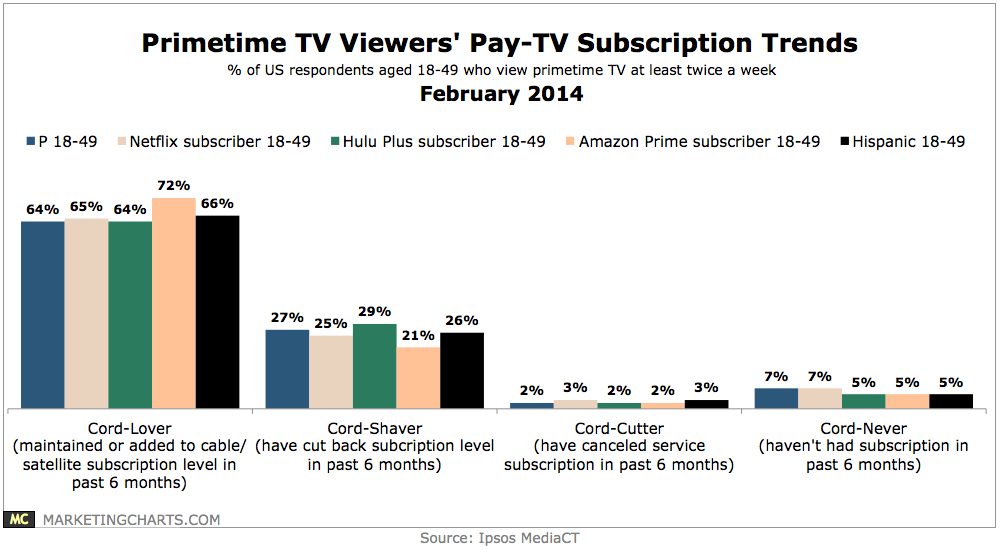
Read MorePrimetime TV Viewers' Pay-TV Subscription Trends, February 2014 [CHART]
Some 64% of American prime-time TV viewers aged 18-49 claim to be Cord-Lovers, having maintained or added to their current level of cable/satellite subscription during the past 6 months.
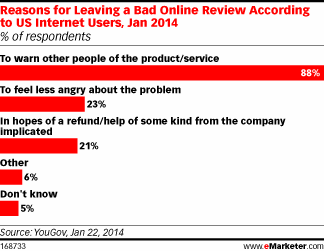
Read MoreReasons People Post Negative Reviews, January 2014 [CHART]
Among those who had left a bad review, the main motivation was to warn off other consumers about a poor product or experience.
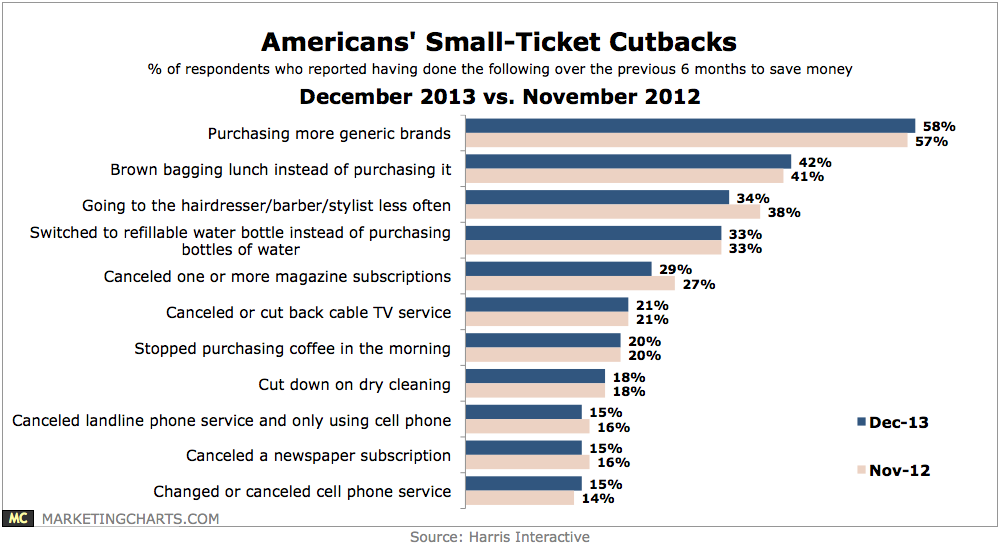
Read MoreAmericans' Small-Ticket Budget Cutbacks, November 2012 vs December 2013 [CHART]
Americans ended 2013 slightly less likely to have been cutting back on small-ticket items to save money than they had been earlier on in the year.
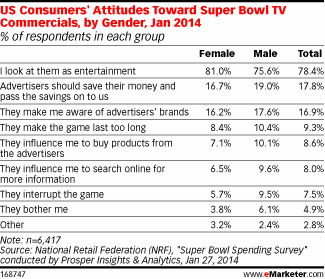
Read MoreAmericans Attitudes Toward Super Bowl Ads By Gender, January 2014 [TABLE]
US adults will spend an average $68.27 on Super Bowl-related items.
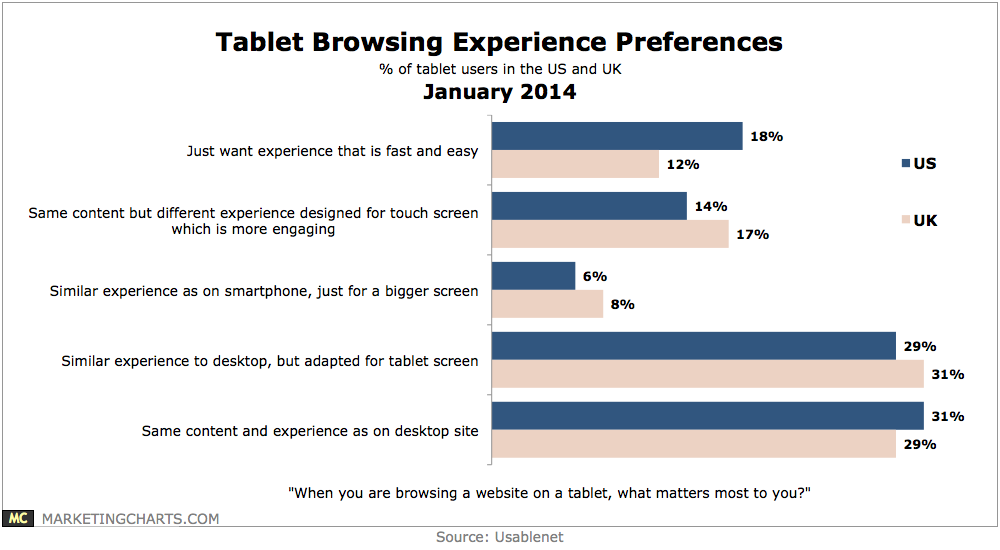
Read MoreTablet Experience Preferences, January 2014 [CHART]
Fewer than 1 in 10 want an experience similar to the smartphone but on a bigger screen.
Read More