Audio Marketing
Smart Speaker Queries Answered Correctly By Category [CHART]
Loup Ventures recently tested four smart speakers by asking Alexa, Siri, Google Assistant, and Cortana 800 questions each. Google Assistant was able to answer 88% of them correctly vs. Siri at 75%.
Read MoreTop Podcast Genres In US [CHART]
Podcast audiences continue to grow, but which genres are proving most resonant with listeners?
Read MoreVoice Command Use Frequency By Device [CHART]
According to an August 2018 Social Lens survey, 70% of US internet users have ever used a voice command on any device, though that figure drops to one-third for those who use them as part of their daily routine.
Read MoreAudio Sources For Smart Speaker Owners [CHART]
Streaming music is one of the most common uses of Smart Speakers, and there’s evidence now that Smart Speaker owners are beginning to default to their devices for all their audio needs.
Read MoreVoice Activation Timeline [INFOGRAPHIC]
This infographic from Zazzle illustrates the timeline of voice activation technology from advent of Siri to the adoption of hands-free inupt in automobiles.
Read MoreVoice Commerce Appeal By Product Categories [CHART]
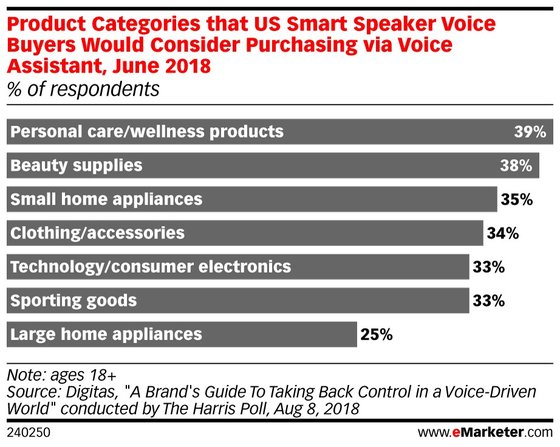
According to a Digitas survey, conducted by The Harris Poll, US smart speaker buyers are most receptive to buying personal care/wellness products (39%) and beauty supplies (38%) via voice commerce.
Read MoreProgrammatic Advertising Channels [CHART]
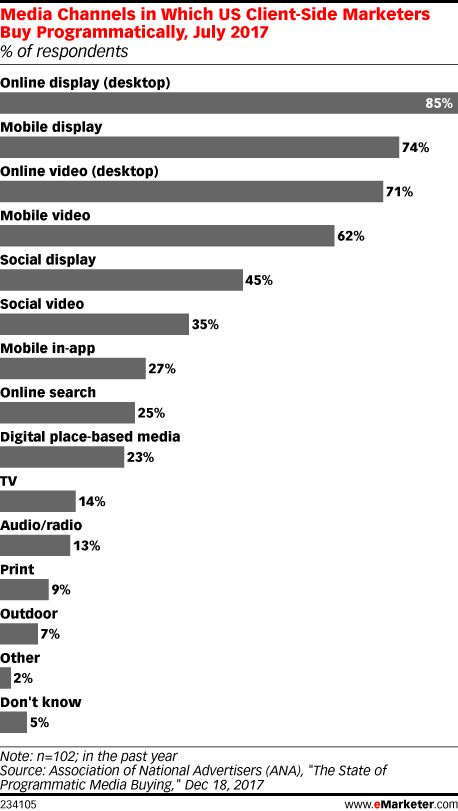
Compared with other ad formats sold through automation, programmatic audio has been slow to catch on. A host of factors have held back programmatic audio, some associated with audience and spending patterns, but many tied to technical issues.
Read MorePodcast Advertising Market Size, 2016-2020 [CHART]
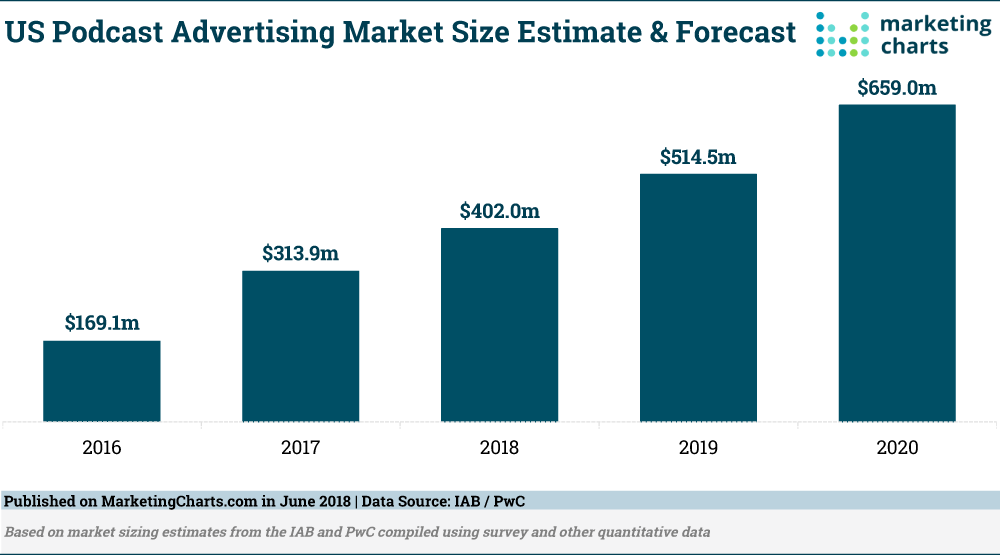
The total US podcast advertising market grew by 86% in 2017 to reach $313.9 million. Companies directly reporting podcast advertising revenues – which collectively represent less than 100% of the podcast ad market – said their ad revenues more than doubled year-over-year.
Read MoreTraditional Media Consumption By Channel, 2011-2018 [CHART]
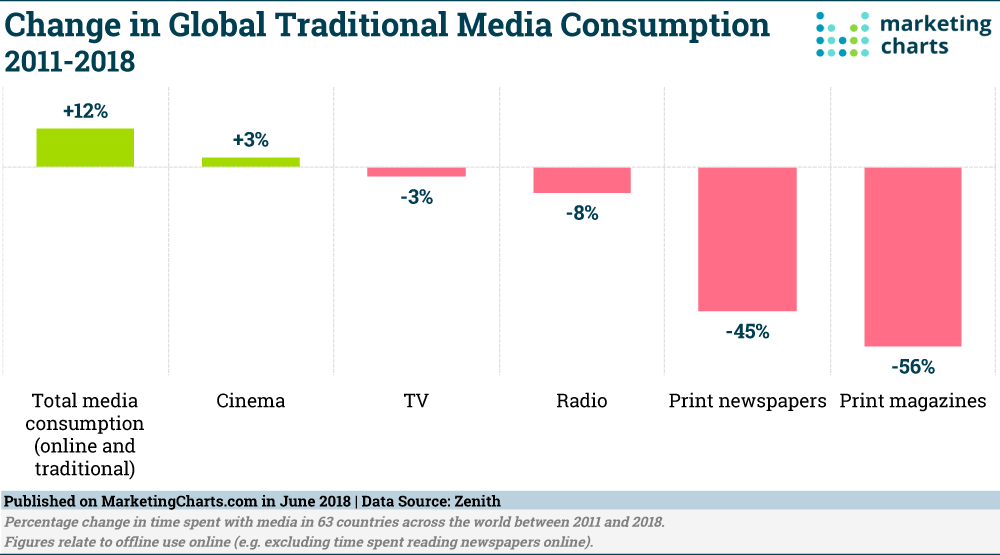
People around the world are expected to spend about 8 hours a day consuming media this year, representing a 12% jump from 2011.
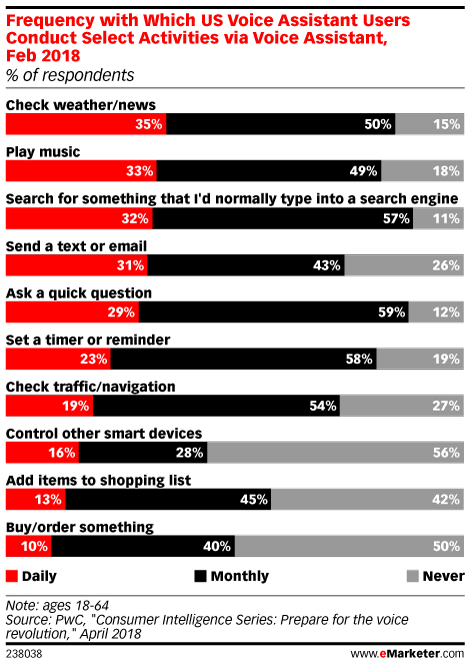
Read MoreMost Popular Voice Activated Activities [CHART]
Research conducted in the US by PwC in February 2018 found that searching for information, playing music, sending messages and shopping were among the activities conducted by large percentages of voice assistant users.
Read More