Advertising
Global Social Media Ad Spending Per Social Network User By Region, 2012-2015 [TABLE]
Advertisers will invest $32.82 on social network advertising per social network user in North America this year, up from just over $26 in 2013.
Read MoreUS Online Ad Spending Share By Industry & Objective, 2013 [TABLE]
Spending by some verticals—including travel and retail—skewed much more heavily toward direct-response advertising.
Read MoreUS Online Ad Spending Share By Industry, 2013 [CHART]
Between 2012 and 2017, investment in online and mobile paid media will increase from $36.80 billion to $62.83 billion, for a compound annual growth rate of 11.3%.
Read MoreGlobal Mobile Ad Spending, 2012-2017 [CHART]
The No. 1 goal of mobile ad campaigns worldwide in Q3 was to increase mobile traffic to a site, chosen by 34% of respondents.
Read MoreGlobal Mobile Ad Spending Growth By Industry, Q3 2013 [CHART]
The pharmaceutical industry has done the most to increase mobile ad spending as of Q3 2013.
Read More2014 Marketing Budget Plans By Channel [CHART]
9 in 10 business leaders plan to either increase (46%) or maintain (47%) their marketing budgets in 2014.
Read More10 Most Memorable TV Ads Of 2013 [TABLE]
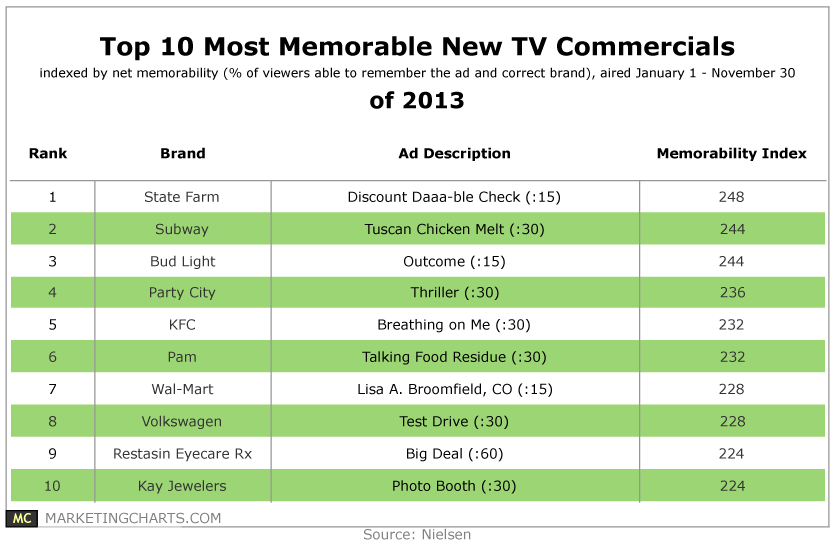
Nielsen recently issued its lists of the year’s most memorable new commercials and best branded product integrations in scripted shows.
Read MoreQ3 US Online Ad Revenues, 2001-2013 [CHART]
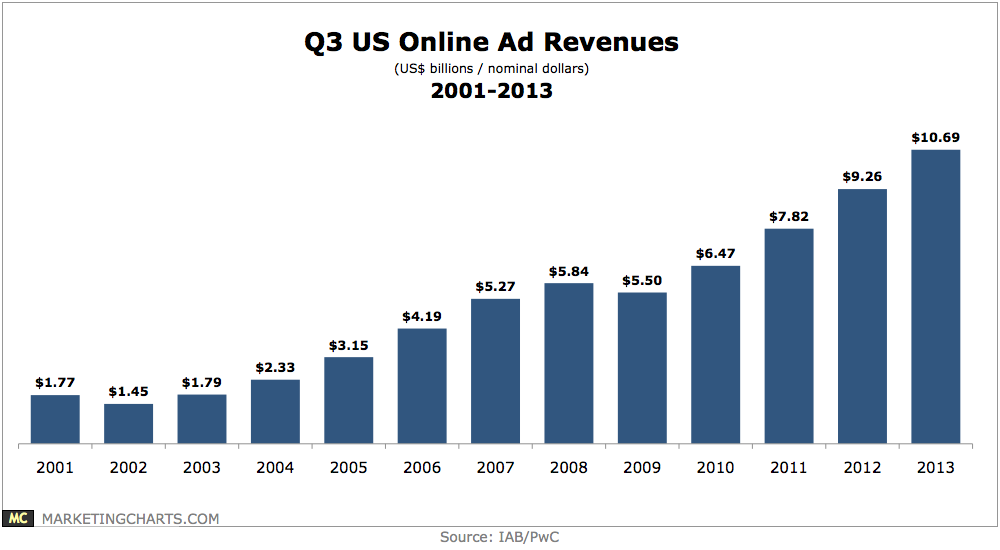
Online ad revenues continue to climb to new heights, growing 15% year-over-year in Q3 from $9.26 billion to $10.69 billion.
Read MoreUS TV Ad Spending Growth Rate vs Overall Average, Q1 2011-Q3 2013 [CHART]
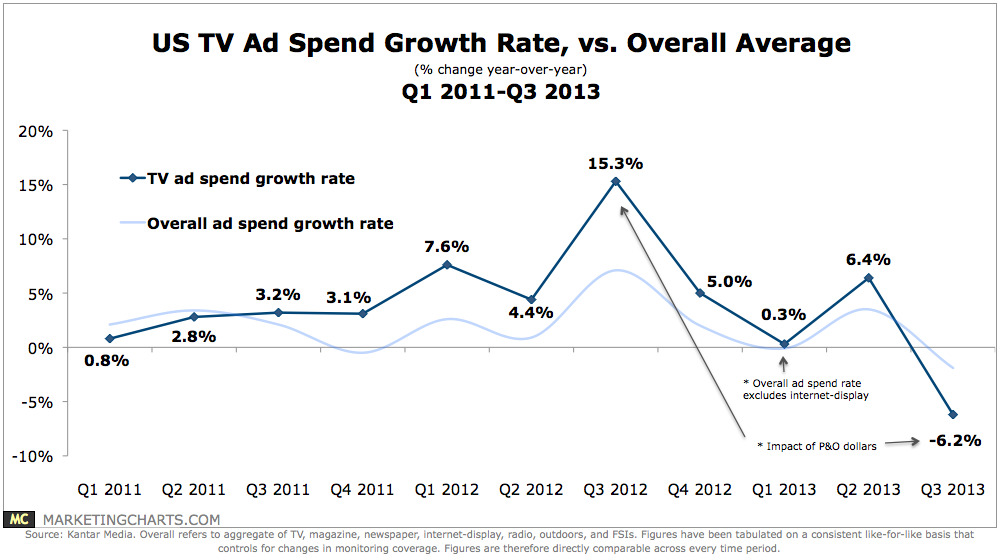
TV ad spending remains healthy even as the medium appears to have reached a plateau in audience numbers.
Read MoreTypes Of Sponsored Social Media Marketers Use, 2011-2013 [CHART]
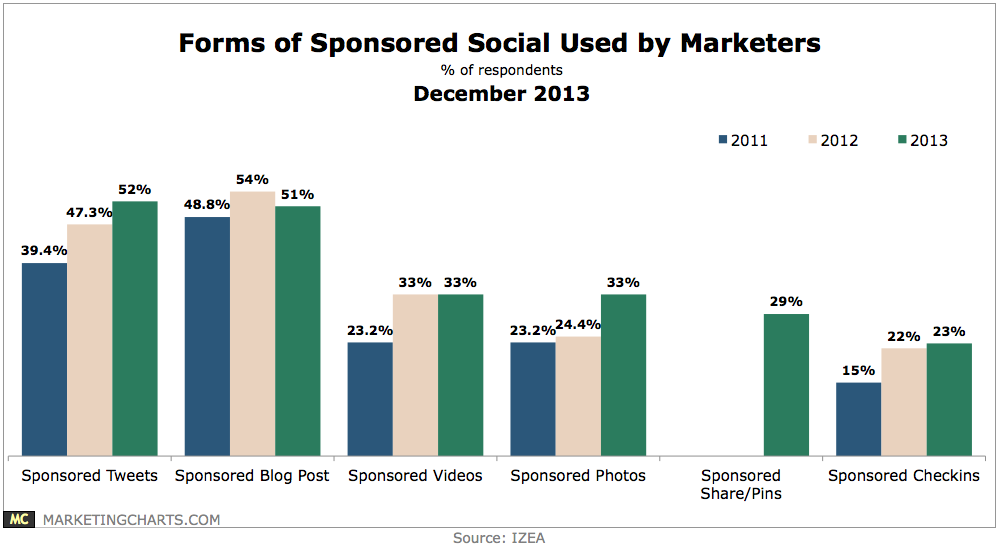
A slight majority (52%) of marketers have used Sponsored Tweets, up from 47.3% last year and 39.4% in 2011.
Read More