Advertising
State Of Native Advertising, 2014 [INFOGRAPHIC]
Copyblogger solicited 2,088 people for their opinions on native advertising for this infographic.
Read MoreOnline Channels In Which US SMBs Plan To Invest, 2013 & 2014 [CHART]
40% of US SMBs planned to increase spending on their company websites this year.
Read MoreTop Contributors To Global Ad Spending Growth, 2013-2016 [CHART]

Mobile will be the prime contributor of new ad spending (accounting for 35% of it), and will grow to account for 7.6% of total ad spend in 2016.
Read MoreAverage Viewability Rates For Video Ads In North America, January 2014 [CHART]
Video ad management and ad-serving platform Vindico found that between September 2013 and December 2013, just 44% of ads served via its Adtricity platform were in-view.
Read MoreDisplay Ads That Are In-View By Timeframe & Platform, H2 2013 [TABLE]
Roughly half of US banner impressions served on advertising networks and exchanges in H2 2013 went unseen.
Read MoreRolling Stone Misreads The Constitution & IKEA Pops Up A Train [VIDEO]

David Erickson and B.L. Ochman discuss Social Media Song featured at the Social Media World Summit; the Heartbleed bug; Rolling Stone magazine’s historically-inaccurate cover; Richard Branson’s search for his inspiration for Virgin Galactic; IKEA’s popup store on a train; Fabrege’s egg hunt; Minnesota Vikings content marketing efforts;
Read MoreMost Effective Tactics For Improving Customer Lifetime Value, April 2014 [CHART]
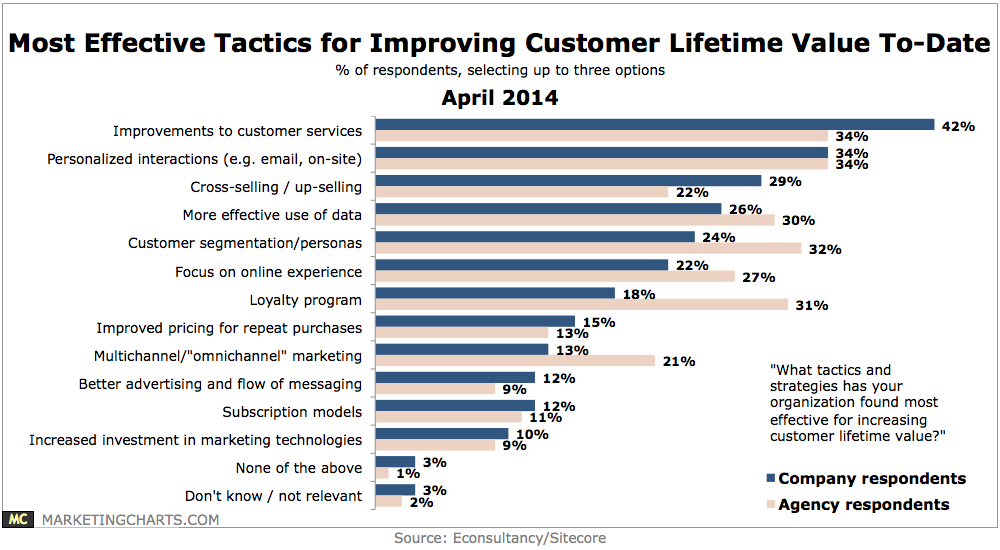
About 3 in 4 global company marketers (primarily based in Europe) agree that customer lifetime value (CLV) is an important concept for their organization.
Read MoreMarketing Channels Most Often Used With Email, February 2014 [CHART]
More than six in 10 marketers worldwide said that landing pages were the marketing channel most often integrated with their email programs.
Read MoreGlobal Online Ad Spending Share, 2012-2018 [TABLE]
The US is still the single biggest spender on digital ads, with North America thus the highest-spending region.
Read MoreGlobal Online Ad Spending, 2012-2018 [CHART]
Spending on ads served to internet-connected devices including desktop and laptop computers, mobile phones and tablets will reach $137.53 billion this year.
Read More