Advertising
Ad Spending In Sweden By Media, 2013 [TABLE]
Ad spending on daily newspapers dropped 13.4%, and magazines saw a 14.5% decline.
Read MoreConsumption-Adjusted Ad Spend On Major Media, 2010-2014 [CHART]
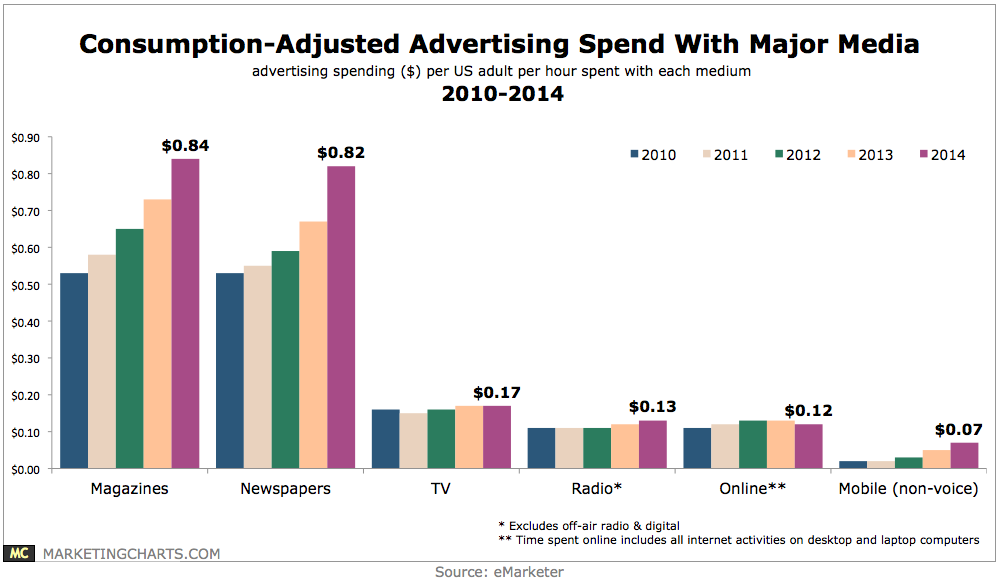
US advertisers are projected to spend 7 cents for every hour a US adult spends on connected mobile activities this year.
Read MoreClients' Online Marketing Talent Gaps, April 2014 [CHART]
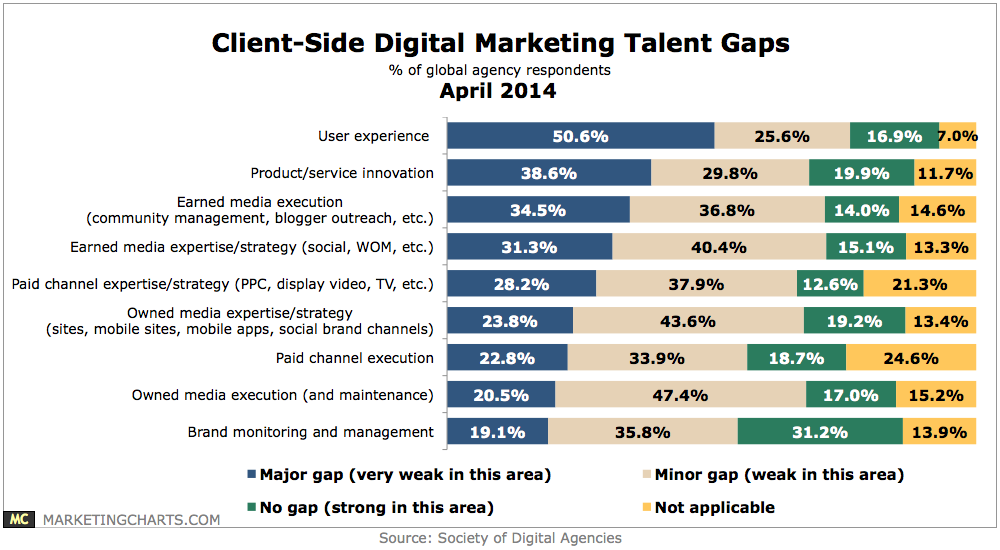
About half of agencies believe that clients have a major talent gap when it comes to user experience, while another quarter feel that clients have a minor talent gap in this area.
Read MoreFacebook’s Mobile Monthly Users & Ad Revenues, Q3 2012 – Q1 2014 [CHART]
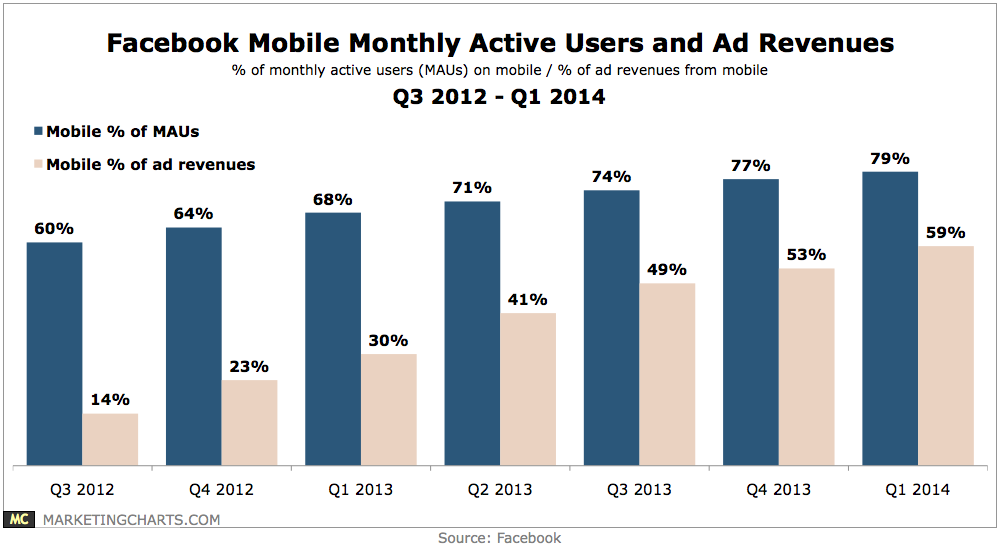
Facebook says it now has more than 1 billion mobile monthly active users to go with WhatsApp’s 500 million users and Instagram’s 200 million.
Read MoreMobile Ad Traffic & Monetization By OS, Q4 2013 vs Q4 2014 [TABLE]
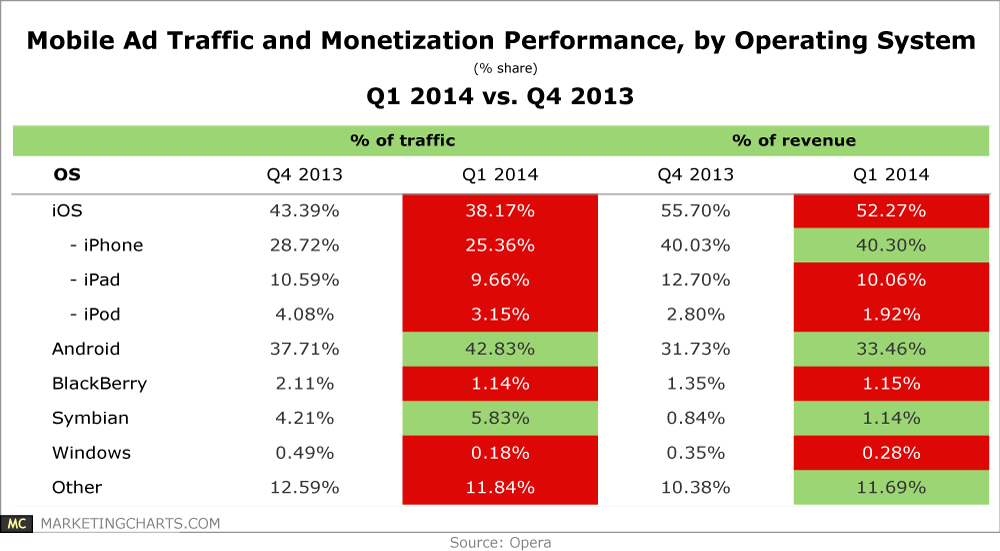
Android took over as the top smart device platform on the Opera Mediaworks platform in Q1, with about 43% of traffic, versus 38% for iOS devices.
Read MorePreferred Mobile Ad Formats, November 2013 [CHART]

Only 12% of US mobile phone owners cited video as their preferred mobile ad format.
Read MoreAmericans Who Will Watch Mobile Ads In Exchange For Premium Content, Q1 2014 [CHART]
44.4% of US smartphone/tablet owners said they would happily or begrudgingly watch a mobile video ad for premium content.
Read MoreUS Major Media Ad Spending Per Hour Spent With Media, 2010-2014 [TABLE]
Print still commands the most ad dollars—despite the fact that it’s losing in terms of absolute time spent with media at double-digit rates each year since at least 2011.
Read MoreFacebook Mobile Advertising Metrics, Q1 2014 [TABLE]
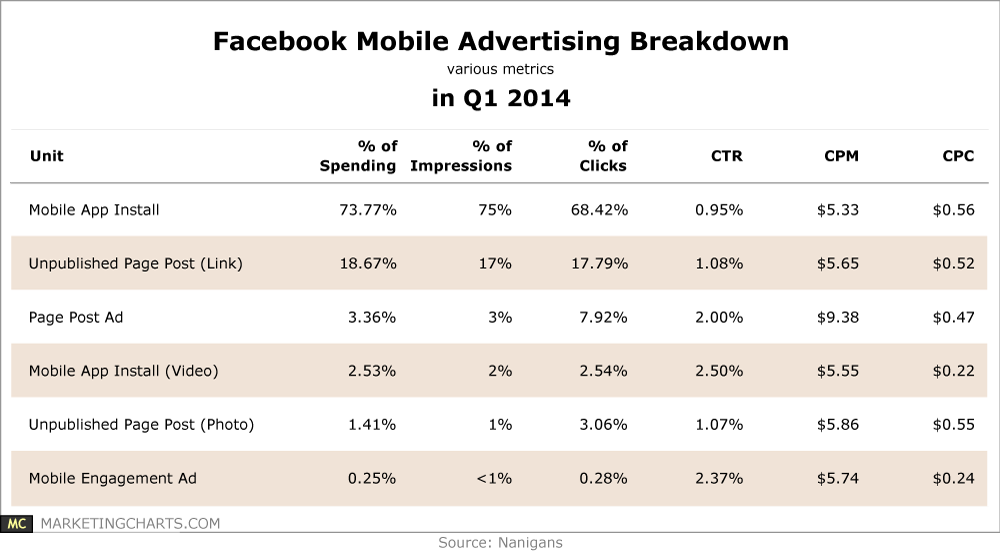
Almost three-quarters of Facebook mobile ad spending was directed at mobile application install ads in Q1.
Read More2013 US Newspaper Revenues [CHART]
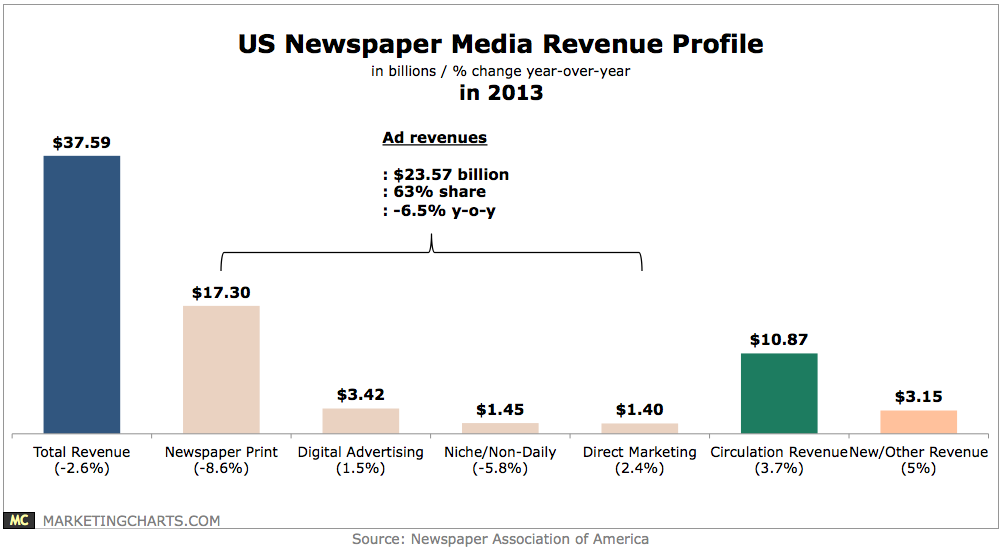
US newspaper cross-platform media revenues shrank by 2.6% year-over-year in 2013 to $37.6 billion.
Read More