Advertising
Benefits Of Customer Experience Optimization, December 2014 [TABLE]
Less than one-fifth of respondents (18%) in both groups said they or their clients used a single customer profile for all marketing efforts, vs. 45% of marketers and 33% of agencies who didn’t.
Read MoreClick-Through Rate For US Facebook Ads By Industry, Q4 2014 [CHART]
Clickthrough rates (CTRs) for US Facebook ads showed impressive growth throughout 2014.
Read MoreUS Retailers Paid Search Metric Growth For Text vs Product Ads, Q4 2014 [CHART]
US retail paid search clicks for Product Listing Ads and Bing Product Ads combined rose 50.8% year over year in Q4 2014, vs. 6.4% for text ads.
Read MoreRetailer Search Ad Click Share By Search Engine, Q4 2014 [CHART]
Retail advertisers took spending on Product Listing Ads (PLAs) to another level at the end of 2014.
Read MoreTerms That Best Describe Native Advertising, Q4 2014 [CHART]
Two-thirds of Association of National Advertisers respondents agreed that native advertising needed clear disclosure, while just 13% disagreed.
Read MoreImportance Of Select Native Ad Components, Q4 2014 [CHART]
BI Intelligence forecast that US native ad spending would rise by 35.4% in 2015, to $10.7 billion.
Read MoreTop 7 Reasons For Time-Shifting TV, March 2015 [CHART]
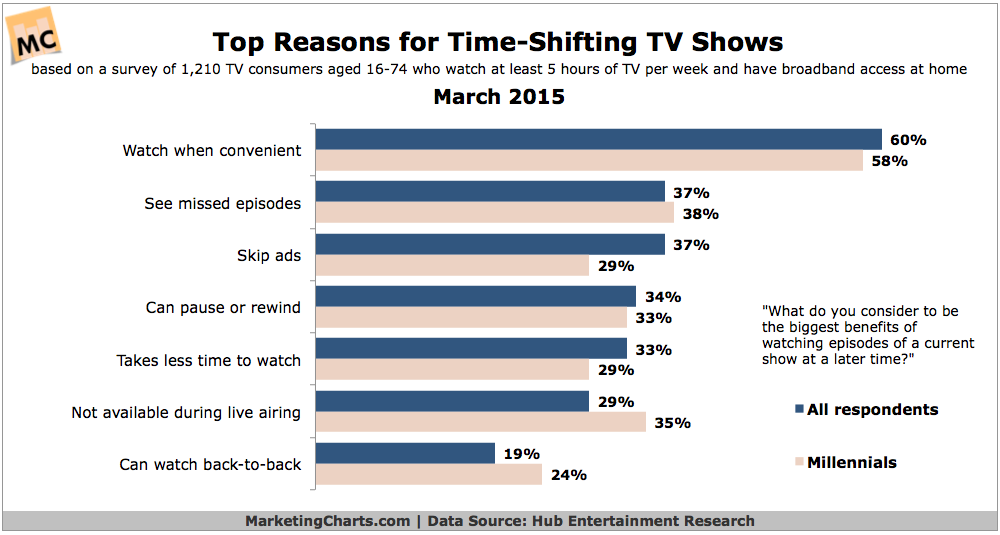
TV viewers claim to spend a slight majority (53%) of their viewing time with time-shifted rather than live (47%) content.
Read MoreGlobal Average Ad Spending Per Capita In 2014 [CHART]
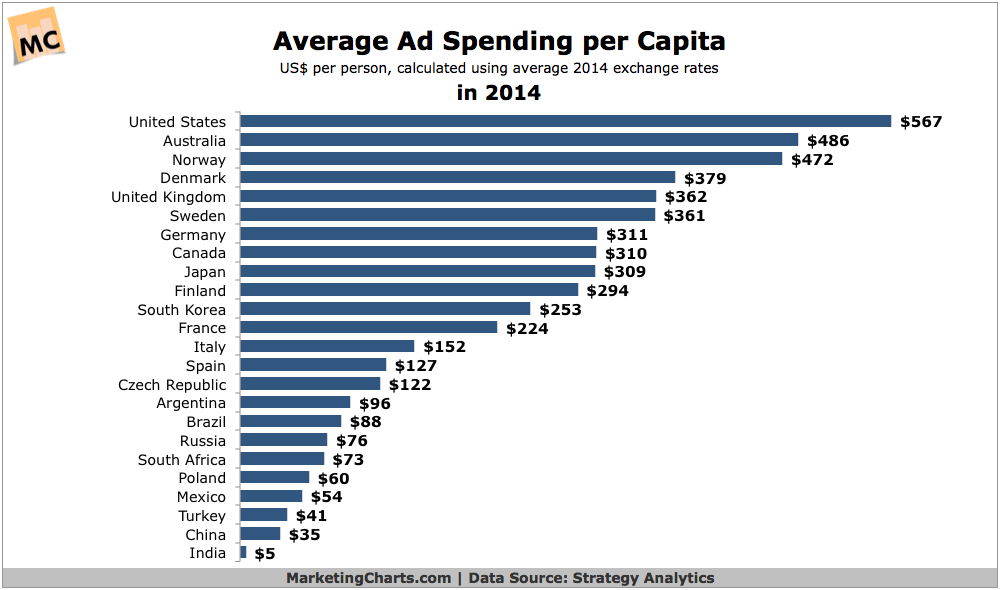
Marketers spent an average of $567 advertising to each person in the US last year, according to Strategy Analytics’ calculations.
Read MoreUS Magazine Ad Spending By Segment, 2013-2018 [TABLE]
US advertisers will spend $19.02 billion on magazine ads in 2015, up just 0.9% from 2014.
Read MoreIn-View Online Video Ad Views By Completion Level, Q4 2014 [CHART]
As viewability rates experienced a strong increase in Q4 2014, US video ad completion rates while in-view did, too, rising 6 percentage points from Q3 2014 to 26.0%.
Read More