Advertising
TV Most Influential Ad Medium For Purchases [CHART]
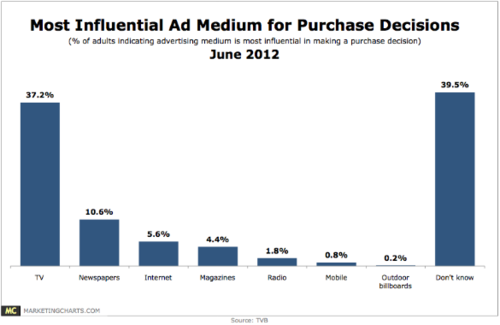
via marketingcharts.com When it comes to the advertising medium they find most influential in making a purchase decision, American adults are far more likely to point to TV (37.2%) than any other, including newspapers (10.6%), the internet (5.6%), and magazines (4.4%), per results from a TVB study released in June 2012. This result aligns with…
Read MoreResponse Rates For Select Media [CHART]
via marketingcharts.com Direct mail campaigns benefit from higher response rates than various other channels, finds the Direct Marketing Association (DMA) in a June 2012 study. Comparing rates over time, the report indicates that the response rate for direct mail to an existing customer averages 3.4%, compared to 0.12% for email. Interestingly, (letter-sized) direct mail’s relative…
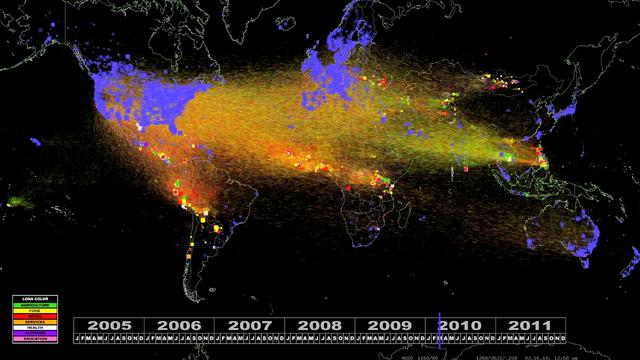
Read MoreUS Political Ad Spending By Media, 2008 & 2012 [CHART]
via emarketer.com Research firm Borrell Associates in March estimated that US political ad spending on the internet would total $159.2 million this year, thanks to all of the attention being paid to the presidential race. While that figure represents only 1.5% of total political ad spending this year, it’s also a massive 617% increase from…
Read MoreGlobal Entertainment & Media Spending Growth [CHART]
via marketingcharts.com Global spending on entertainment and media (E&M) increased by 4.9% in 2011, slightly more rapid than 2010’s 4.5% growth, but representing a lower rate than in previous years, according to a June 2012 report from PricewaterhouseCoopers (PwC). Internet advertising saw the fastest growth, of 18.7%, followed by TV subscriptions and license fees (excluding…
Read MoreMobile Ad Spending Growth By Vertical [CHART]
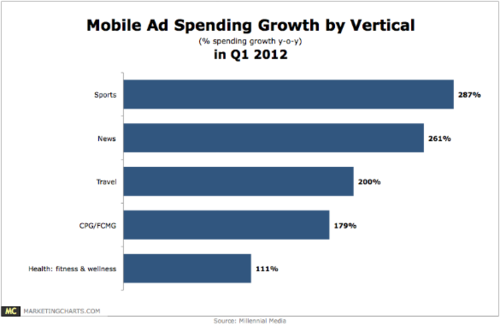
Sports led the way with the largest increase, at an impressive 287%, followed by news, with a 261% jump.
Read MoreThe Shift Toward Digital Ad Spending [CHART]
via marketingcharts.com rswus-spending-shift-traditional-digital-ads-june2012.pngAlmost 3 in 10 marketers say they have shifted at least half of their marketing spending from traditional to digital advertising over the past 3 years, according to June 2012 survey results from RSW/US. The data also shows that 2 in 3 have moved at least 30% of their budgets from traditional to…
Read MoreTop 5 Most Trustworthy Info Sources Are Traditional Channels [CHART]
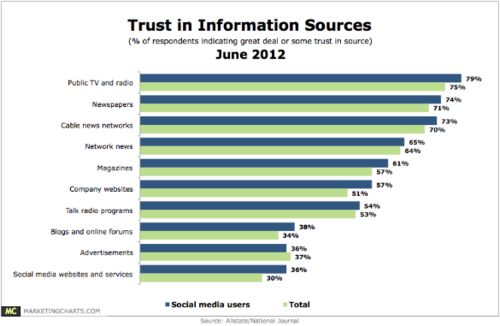
via marketingcharts.com Traditional media reign supreme when it comes to Americans’ trust in information sources, according to [pdf] a survey released in June 2012 by Allstate, in association with National Journal. Three-quarters of the survey respondents said they trust information from public TV and radio either some or a great deal, more than double those…
Read MoreGlobal Promoted Tweet Clickers, By Frequency [CHART]
via emarketer.com On the mobile front, Pew found that 9% of all mobile phone owners used Twitter on their phones, including 22% of users ages 18 to 24. Meanwhile, marketers are focusing on Twitter’s advertising products, Promoted Tweets, Trends and Accounts, and determining how well they work for their brands. In January 2012, search engine…
Read MoreMobile Click-Through Rates By Device [CHART]
via emarketer.com The study examined the CTRs earned by eight mobile devices, the largest being the Samsung Galaxy Tab (10.1 inches), and the smallest being the Sony Xperia Mini (2.5 inches). The Kindle Fire, with a middle-of-the-pack, 7-inch screen, had the highest CTR—1.02%. The iPad, with a screen size of 9.7 inches, had a CTR…
Read MoreFacebook Ad Relevance [CHART]
via emarketer.com Perhaps better targeted, more relevant ads will improve Facebook users’ perceptions and their willingness to engage with Facebook ad content in the future. According to AYTM Market Research, as of May, less than half of surveyed Facebook users believed Facebook ads were very or somewhat relevant to their interests. Read the rest at…
Read More