Advertising
Facebook Ad Spending By Mobile Devices, January 2013 [CHART]
Mobile devices (phones and tablets) now account for 20.3% of overall Facebook ad spending.
Read MoreGlobal Mobile Ad Spending By Region, 2011-2016 [CHART]
North America already has an edge on other world regions, and will widen that gap considerably by 2016.
Read MoreGlobal Mobile Ad Spending Growth By Region & Country, 2011-2016 [CHART]
The fastest growth in 2012 came from North America, especially the US, where mobile search and display ad spending was up 220%.
Read MoreGlobal Mobile Ad Spending, 2010-2016 [CHART]
Mobile ad spending around the world more than doubled last year, eMarketer estimates.
Read MoreConsumer Attitudes Toward Advertising Creative & Product Recall, January 2013 [CHART]
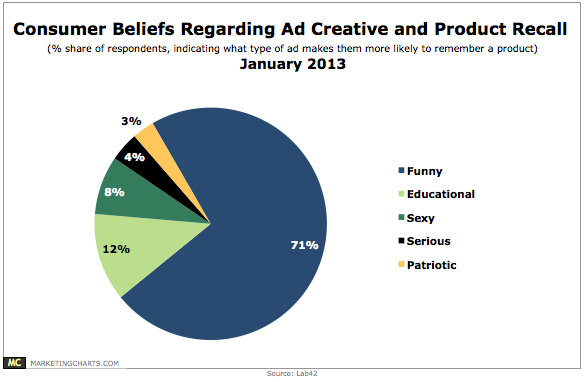
The most-liked TV ads in 2012 relied on audience-appropriate humor, an ownable creative concept and a relatable, emotional appeal.
Read MoreConsumer Trust In Advertising, January 2013 [CHART]
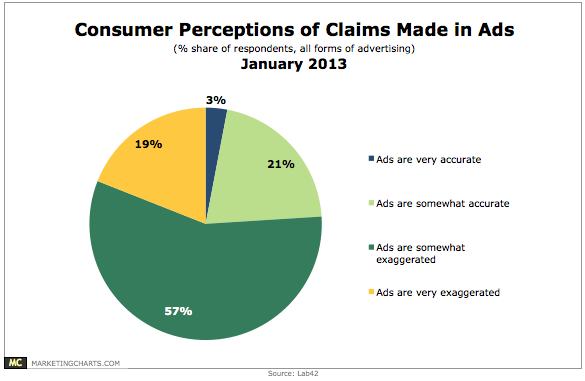
Just 3% of Americans believe that claims made in ads are very accurate, with far more (19%) believing them to be very exaggerated.
Read MoreTop 2012 TV Brand Advertisers By Category [TABLE]
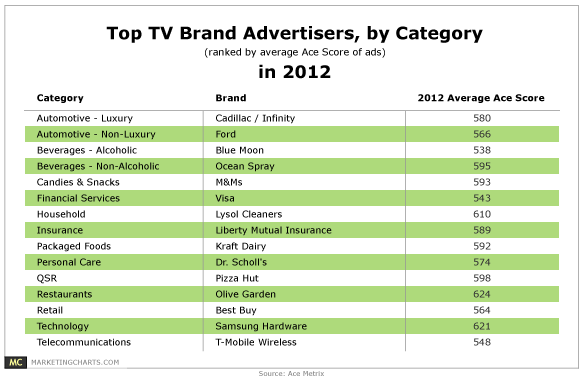
2012 television brand advertising was marked by creative strategies that stressed innovation while embracing cause and humor.
Read MoreB2B Online Marketing Tactics, August 2012 [CHART]
B2B marketers said their No. 1 challenge was lack of budget.
Read More10 Most Popular e-Strategy Trends Posts Of 2012 [LIST]
The ten most popular posts this year at e-Strategy Trends, based on the number of page views.
Read MoreMost Effective Traffic Sources For Website Conversion [CHART]
Organic search is the top source for generating website traffic. But, much like actual lead generation, volume alone doesn’t offer much value.
Read More