Advertising
Online Social Video Ads Shared Worldwide By Industry, Q1 2013 [CHART]
Entertainment garnered the most social video shares in Q1 2013, which is unsurprising given the adeptness of the industry at creating video content.
Read MoreOnline Video Ad Views, December 2011 – March 2013 [CHART]
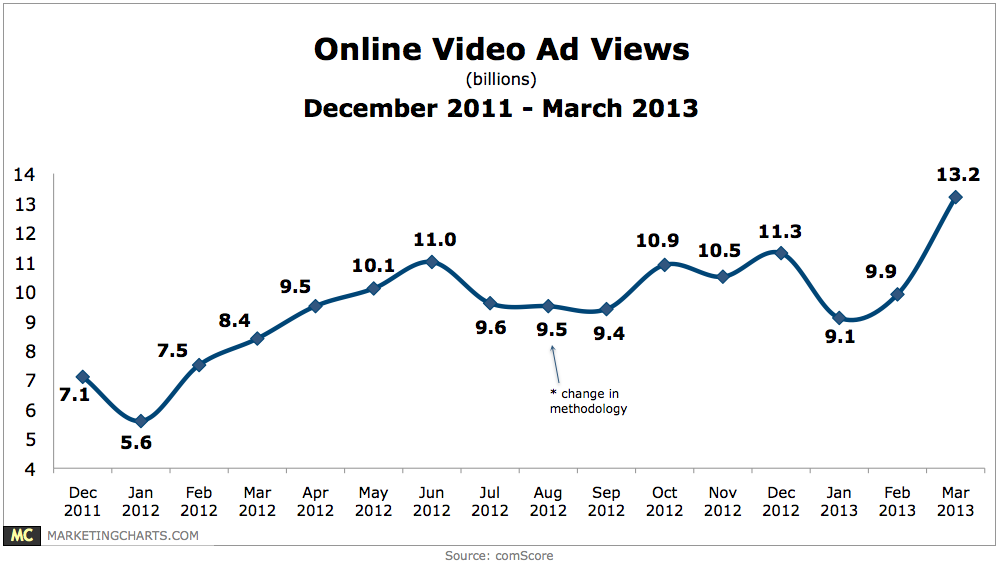
Online video ad views jumped to a record high of 13.2 billion in March, up about 33% month-over-month.
Read MoreLocal TV Ad Revenues, 2006-2017 [CHART]
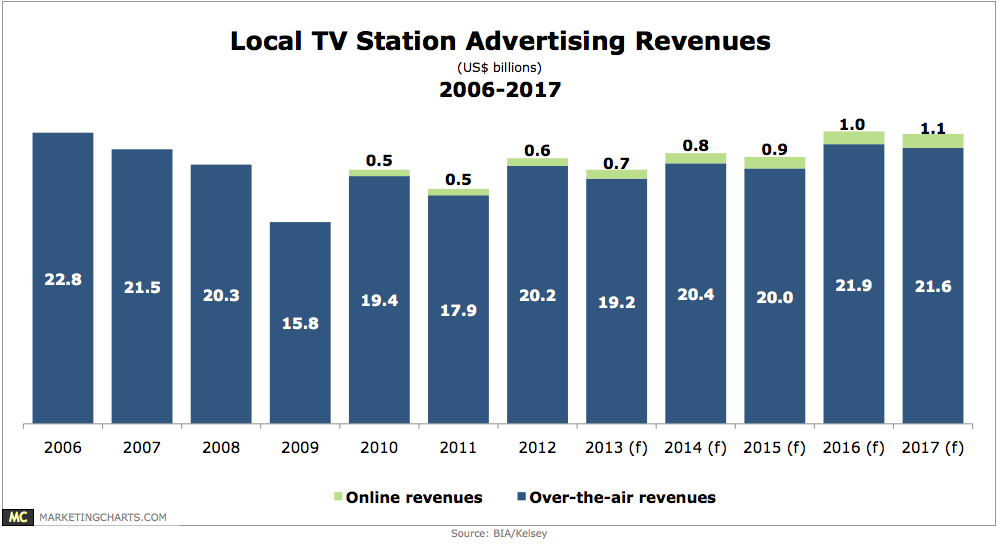
Political advertising fueled a 13% increase in local TV ad revenues last year, to $20.8 billion.
Read MoreCPG Mobile Ad Post-Click Actions, 2012 [TABLE]
44% of CPG advertisers implemented video as a post-click campaign action, compared with only 16% of all advertisers.
Read MorePrimary Goals Of CPG Mobile Advertising, 2012 [TABLE]
When compared with all advertisers, 46% of consumer goods campaigns worldwide in 2012 focused on brand awareness.
Read MoreLead Generation & Conversions By Channel, April 2013 [CHART]
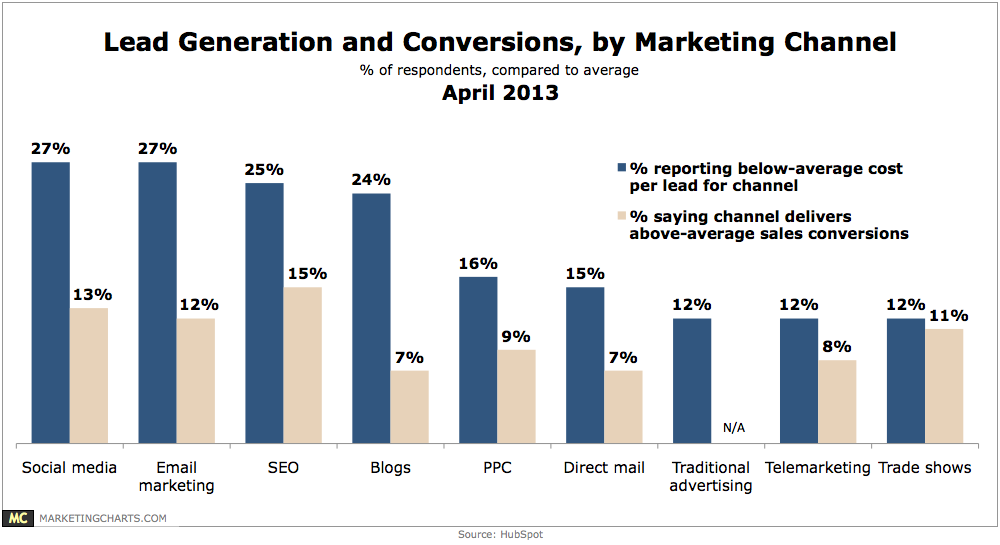
27% of marketers report below-average costs per lead (CPLs) for both email marketing and social media, with SEO and blogs close behind (25% and 24%, respectively).
Read MoreConsumers' Reaction To Spam, March 2013 [CHART]
Of those who had been overwhelmed by online ad spam, more than one-third said they would leave the website they were on as a result.
Read MoreMost Annoying Types Of Online Ads, March 2013 [CHART]
Among types of online ads, irrelevant pop-up ads irked the greatest percentage of respondents (79%).
Read MoreTop Sources Of Annoying Ads, March 2013 [CHART]
More than nine in 10 internet users reported encountering an annoying ad somewhere, according to the poll.
Read MoreGlobal Search Advertising Trends, Q1 2013 [CHART]
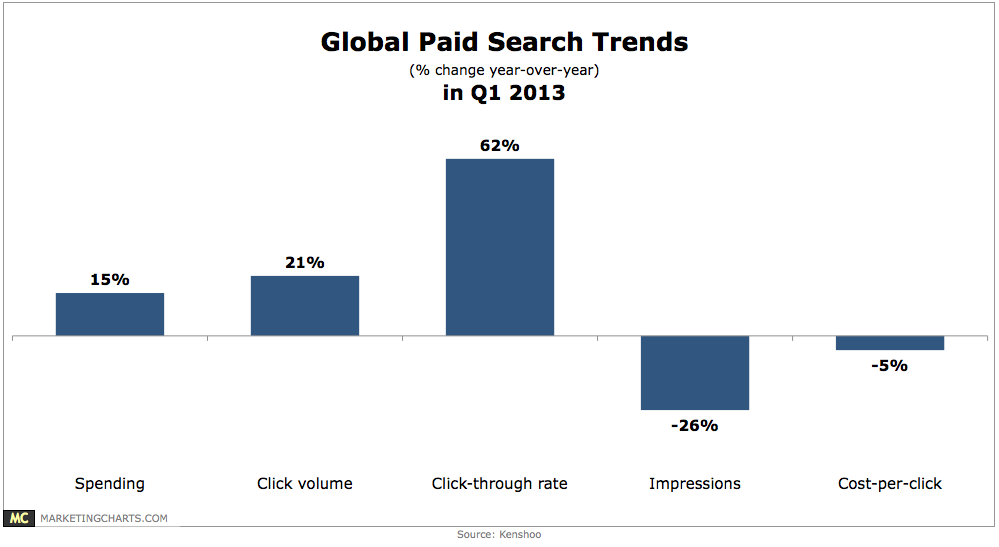
On a global basis, paid search click volume (+21%) and click-through rates (+62%) each saw strong growth, with spending up 15%.
Read More