Ad Spending
Top 10 Advertising Sectors In 2012 [CHART]

At roughly $16.3 billion – up 3% from $15.9 billion in 2011 – the retail sector accounted for more than 11% of total US ad spend (excluding FSI/PSA).
Read MoreChange In Digital & Traditional Ad Spending According to B2C & B2B Marketers By Sector, February 2013 [CHART]
The increase in digital ad spending was projected to be most dramatic in the business-to-consumer (B2C) product category, which was expected to se a 14.6% bump over the 12 months following February 2013.
Read MoreChange In Traditional Ad Spending, August 2011-February 2013 [CHART]
The shift from traditional media ad spending to digital continues unabated.
Read MoreUS Ad Spending Changes, Q4 2011 vs Q4 2012 [CHART]
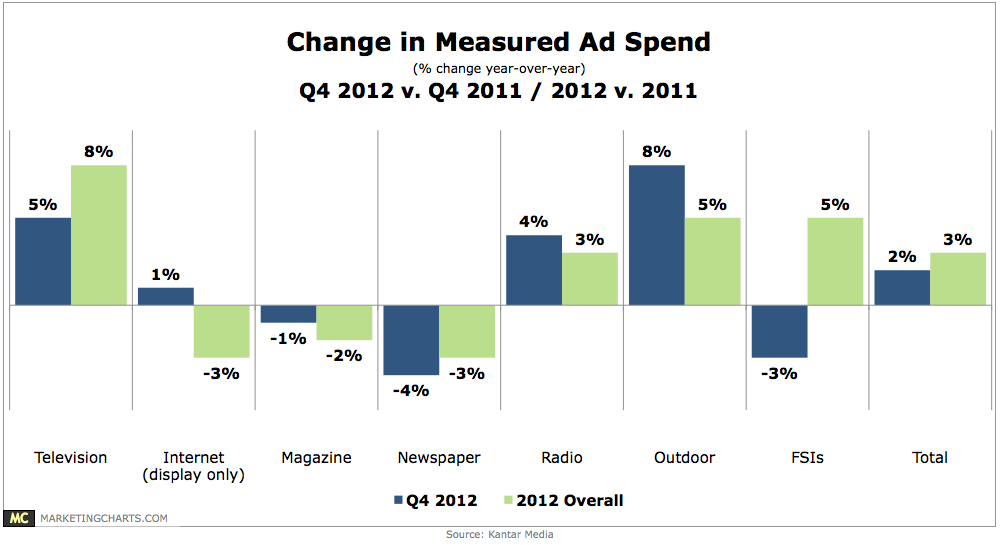
US ad spending increased by 2% year-over-year in Q4 2012, and by 3% for the full year to reach $139.5 billion.
Read MoreUS Radio Ad Spending By Segment, 2010-2016 [CHART]
eMarketer estimates that internet radio ad spending in the US will reach $970 million in 2013 and grow to $1.31 billion by 2016.
Read MoreGlobal Ad Spending Growth, 2011 vs 2012 [CHART]
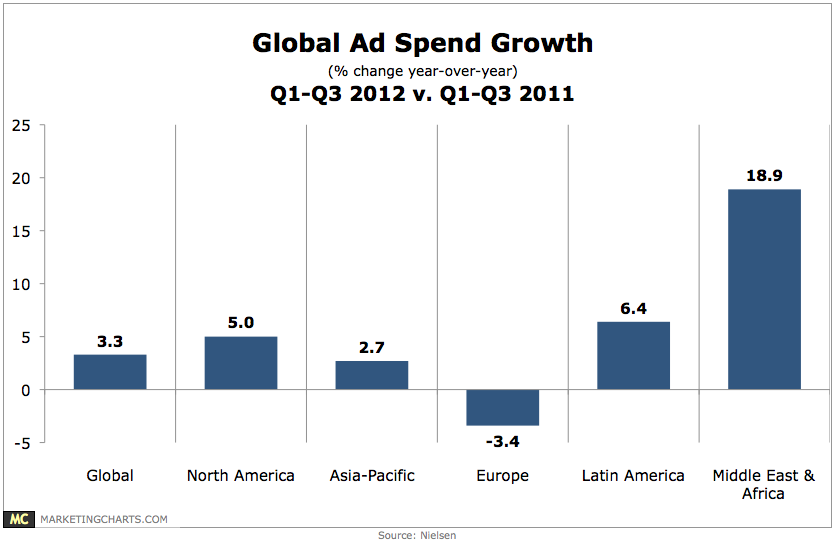
Global ad spending grew by 4.3% year-over-year in Q3 2012, picking up steam after a 2.7% gain in the first half of the year.
Read MoreSMB Local Advertising Spending By Medium, 2012 vs 2013 [CHART]
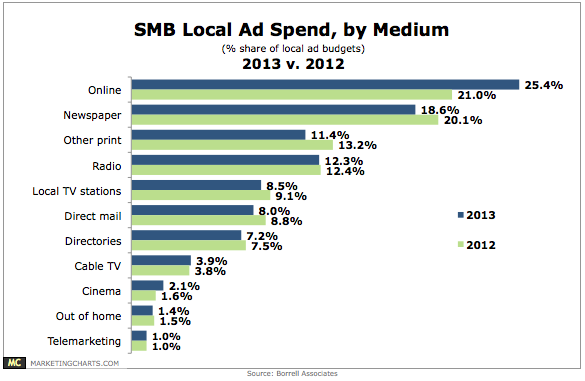
SMBs will devote 26.6% of their local ad budgets to newspapers (18.6%) and other print media (8%) this year.
Read MoreGlobal Digital Ad Spending Growth By Region & Country, 2011-2016 [CHART]
North America accounts for the greatest share of all digital ad spending, at 39% as of the end of 2012.
Read MoreGlobal Digital Ad Spending, 2010-2016 [CHART]
Worldwide, digital ad spending passed the $100-billion mark for the first time last year and will increase by a further 15.1% in 2013 to $118.4 billion.
Read MoreGlobal Mobile Ad Spending Growth By Region & Country, 2011-2016 [CHART]
The fastest growth in 2012 came from North America, especially the US, where mobile search and display ad spending was up 220%.
Read More