Ad Spending
Global Ad Spending Growth By Medium, 2012-2015 [CHART]

Between 2012 and 2015, online ad spending should increase by $47.6 billion, or about two-thirds of the $71.7 billion in projected growth.
Read MoreAdvertisers' Spending Plans By Medium, September 2013 [CHART]
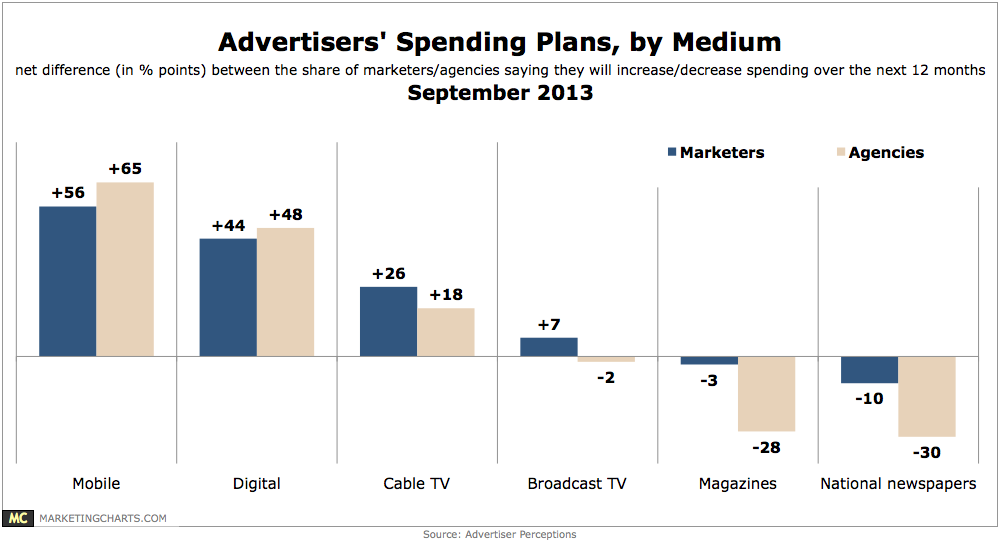
Enthusiasm for cable TV spending is high, with the share of respondents saying they plan to increase ad spending on cable TV outweighing the share indicating they’ll decrease spending.
Read MoreGlobal Mobile Ad Spending By Region, 2011-2017 [TABLE]

Mobile spending will hit nearly $15.82 billion, representing a whopping 79.7% year-over-year increase.
Read MoreGlobal Ad Spending By Region, 2011-2017 [TABLE]

Global ad spending will rise 2.8% to more than half a trillion dollars in 2013.
Read MoreNative Advertising & Content Creation Spending Plans, September 2013 [CHART]
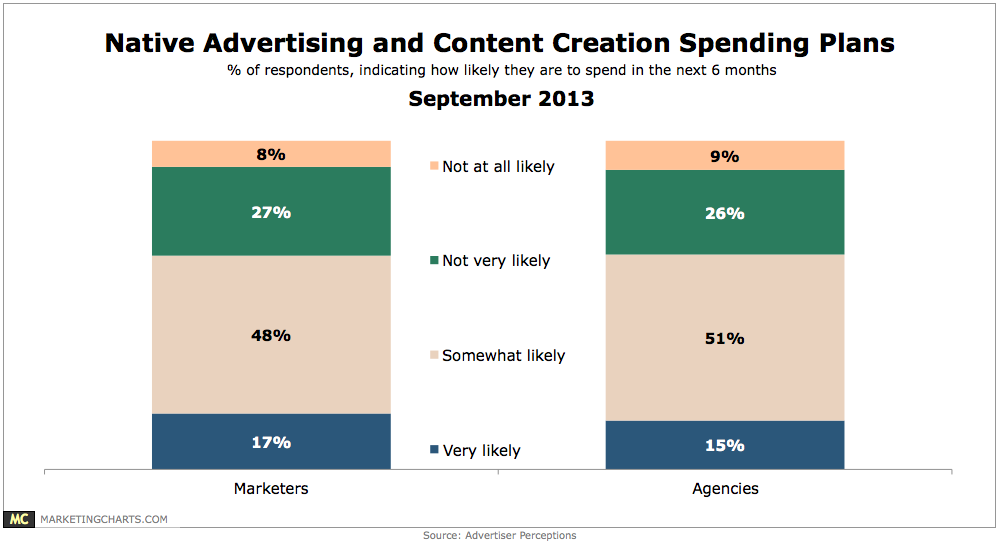
Roughly 2 in 3 marketers and agencies surveyed indicated that they are somewhat or very likely to spend on native ads and content creation in the next 6 months.
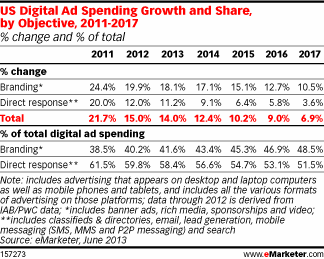
Read MoreUS Online Ad Spending Share By Objective, 2013-2017 [CHART]
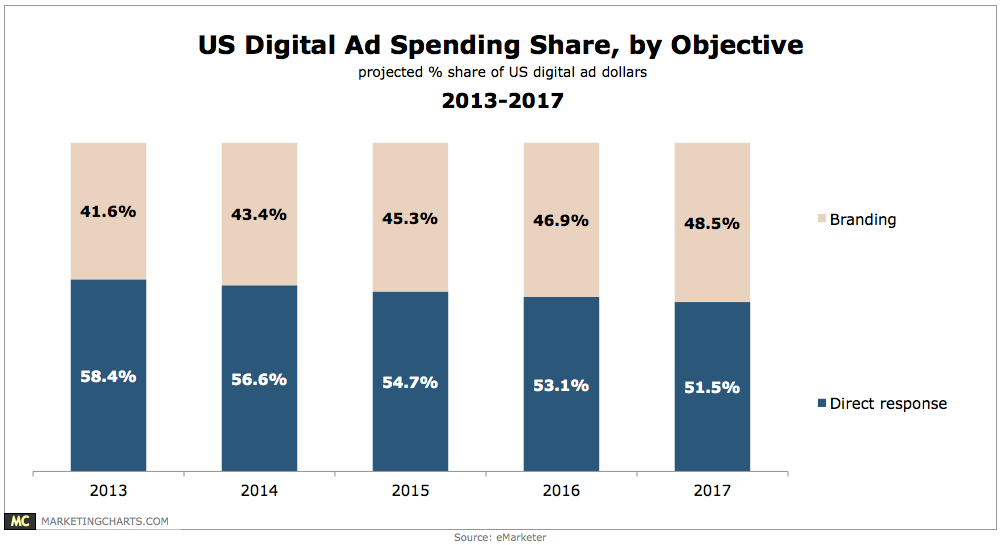
Digital ad spending is currently weighted towards direct response over branding, but that tilt will soon disappear.
Read MoreTop American Companies By Ad Spending, Q2 2012 & Q2 2013 [TABLE]
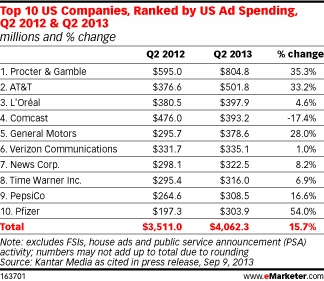
Retail remained the top spending ad category, but growth in Q2 2013 was minimal compared to a year prior, at only 0.1%.
Read MoreUS Ad Spending Growth By Media [CHART]
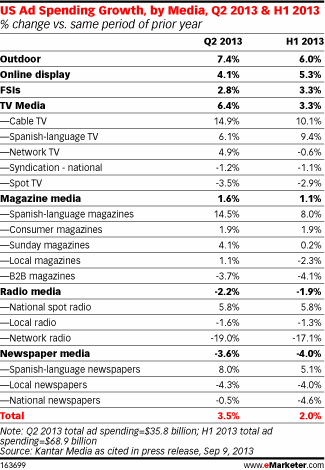
For the first half of 2013, Kantar Media estimated that the total US ad spend market rose 2.0%, compared with the same period one year earlier.
Read MoreUS Online Ad Spending Growth & Share By Objective, 2011-2017 [TABLE]
eMarketer estimates that out of a total of $41.94 billion in US digital ad spending in 2013, nearly 60% will go toward direct response.
Read MoreChanges In Ad Spending By Medium [CHART]
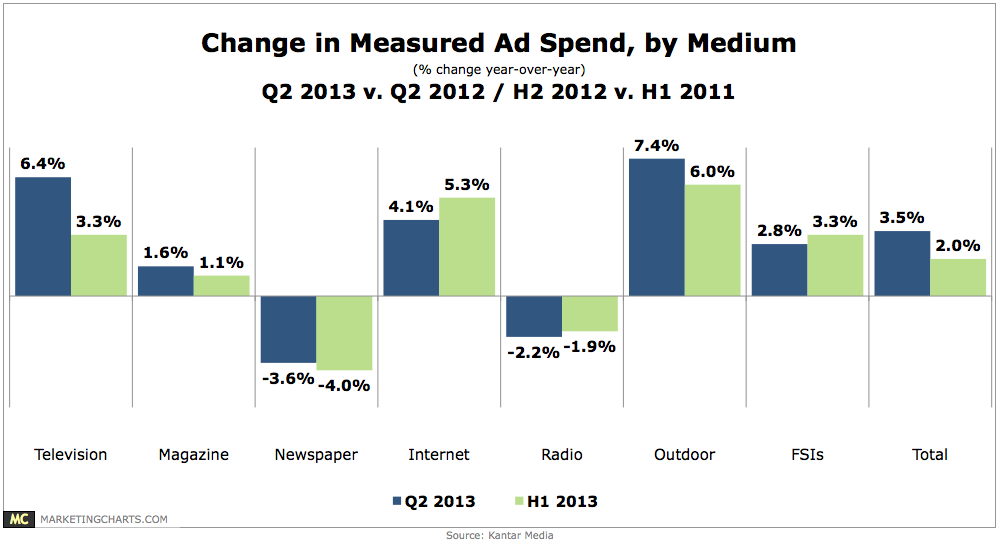
US ad spending increased by 3.5% year-over-year in the second quarter of the year to reach $35.8 billion, dragging first-half expenditures up by 2% to $68.9 billion.
Read More