Ad Spending
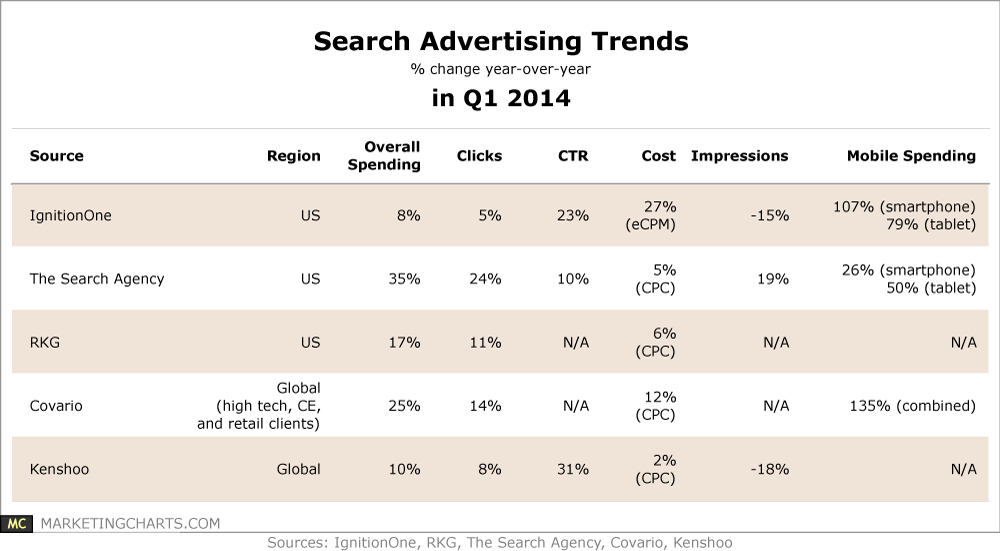
Search Advertising Trends, Q1 2014 [TABLE]
Spending is up (particularly on mobile), as are click-through rates.
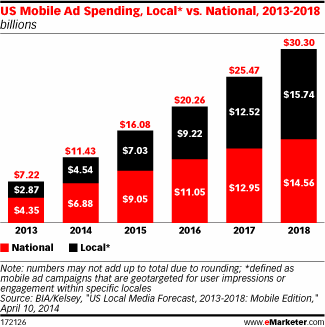
Read MoreUS Local vs. National Mobile Ad Spending, 2013-2018 [CHART]
Berg Insight predicted that ad revenues from social networking and local search would drive mobile local ad spending.
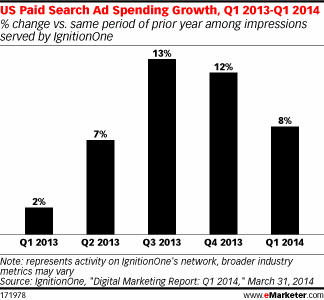
Read MoreUS Paid Search Ad Spending Growth, Q1 2013 – Q1 2014 [CHART]
65% of marketers were using data collected from PLAs to better inform other paid search and cross-channel strategies.
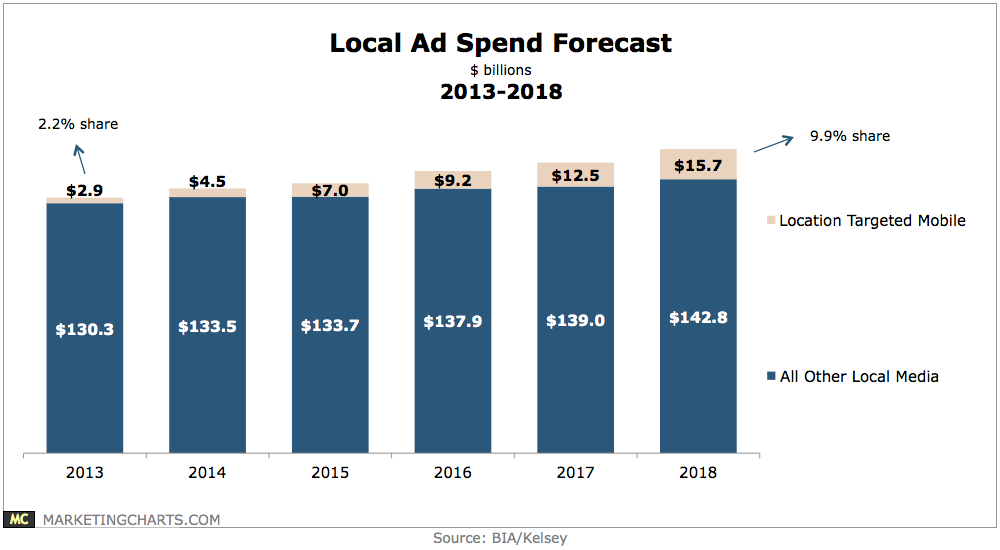
Read MoreLocal Ad Spending Forecast, 2013-2018 [CHART]
US mobile ad spend is projected to grow from $7.2 billion last year to $30.3 billion in 2018, with a slight majority 52% – or $15.7 billion – of that eventual figure being location-targeted spending.
Read MoreTop Contributors To Global Ad Spending Growth, 2013-2016 [CHART]
Mobile will be the prime contributor of new ad spending (accounting for 35% of it), and will grow to account for 7.6% of total ad spend in 2016.
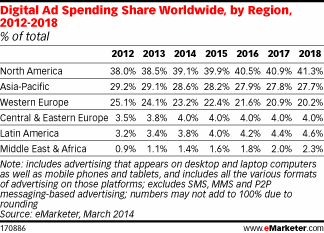
Read MoreGlobal Online Ad Spending Share, 2012-2018 [TABLE]
The US is still the single biggest spender on digital ads, with North America thus the highest-spending region.
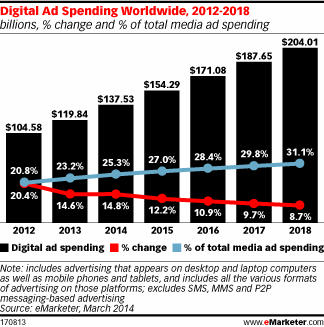
Read MoreGlobal Online Ad Spending, 2012-2018 [CHART]
Spending on ads served to internet-connected devices including desktop and laptop computers, mobile phones and tablets will reach $137.53 billion this year.
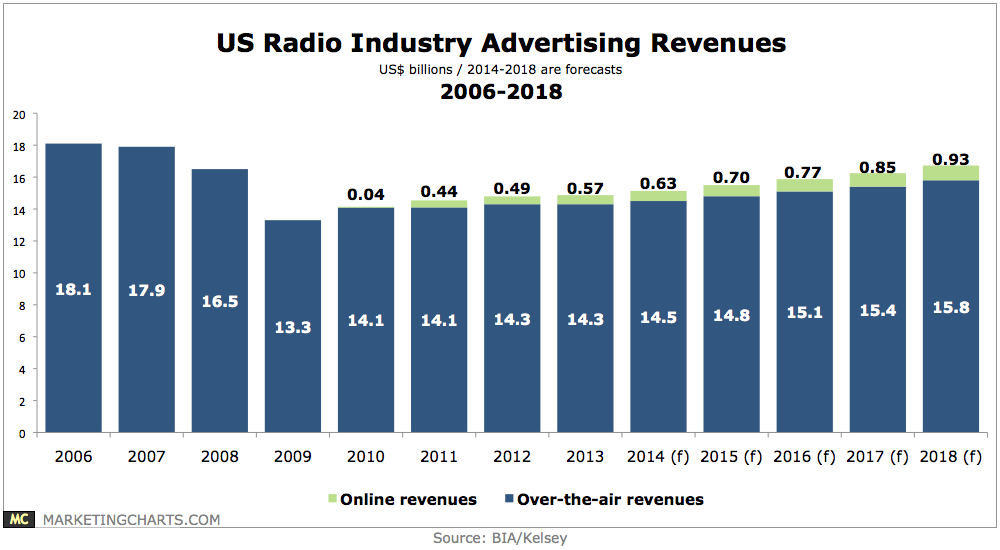
Read MoreUS Radio Ad Revenues, 2006-2018 [CHART]
BIA/Kelsey notes that radio revenue was mostly flat last year, a result consistent with the Radio Advertising Bureau’s calculations.
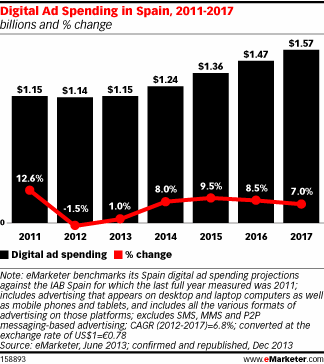
Read MoreOnline Ad Spending In Spain, 2011-2017 [CHART]
The estimates for 2013 digital ad spending from IAB Spain align closely with eMarketer’s calculation of $1.15 billion.
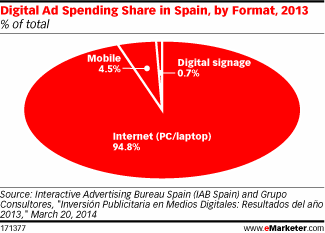
Read MoreOnline Ad Spending Share In Spain By Format, 2013 [CHART]
Spending on mobile ads amounted to just 4.5% of all digital expenditure in 2013, or €39.9 million ($53.2 million).
Read More