Posts by derickson
Holiday eCommerce Spending, 2011 vs 2012 [CHART]
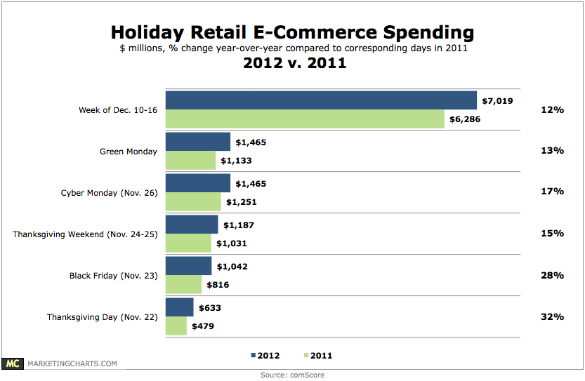
Figures from the Chase Holiday Pulse show a similarly high level of activity during the so-called Green Week (Dec. 10-16).
Read MoreQ3 Internet Advertising Revenues, 2001-2012 [CHART]
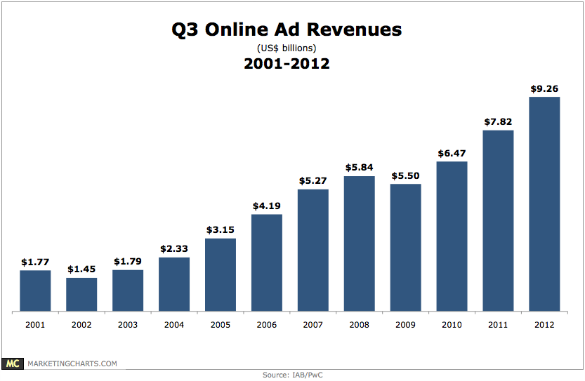
Online ad revenues continue to climb at double-digit rates, growing 18% year-over-year in Q3 from $7.82 billion to $9.26 billion.
Read MoreOnline Shopping Behavior Of The Wealthy, December 2012 [TABLE]
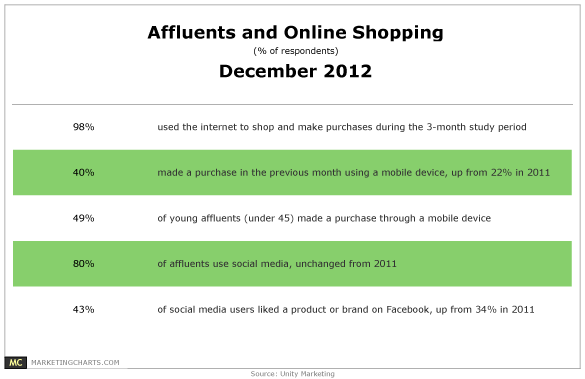
Virtually all (98%) affluent consumers use the internet to shop and make purchases.
Read MoreTop 10 US States By Population Change, July 2011 vs July 2012 [TABLE]
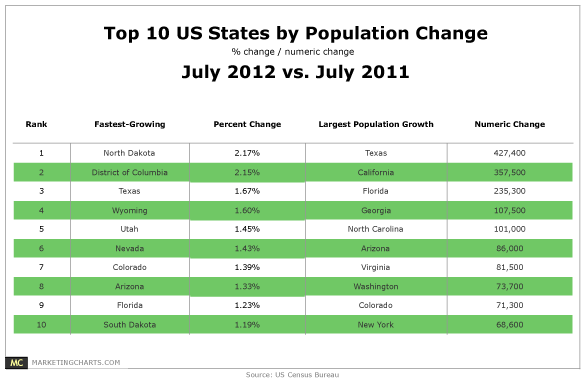
The US population grew by 2.3 million between July 2011 and July 2012 to reach 313.9 million.
Read MoreeMoney [INFOGRAPHIC]
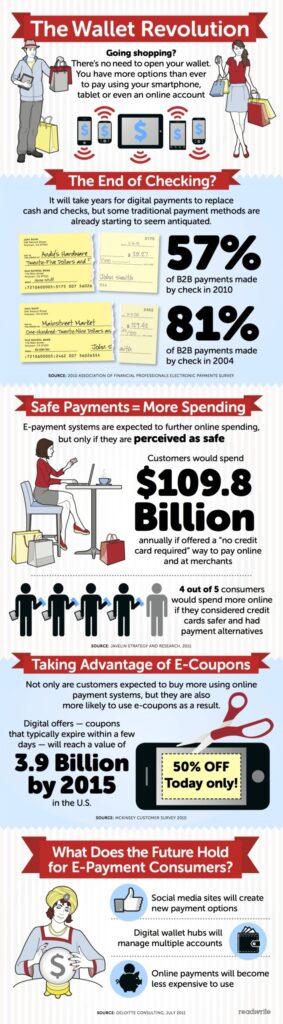
This ReadWrite infographic offers some key data points on the path to digital money.
Read MoreWeb Series Costs [INFOGRAPHIC]

This infographic by The Danger Brain breaks down the costs of producing a web series using Video Game High School as an example.
Read MoreThe Ages Of Social Media [INFOGGRAPHIC]
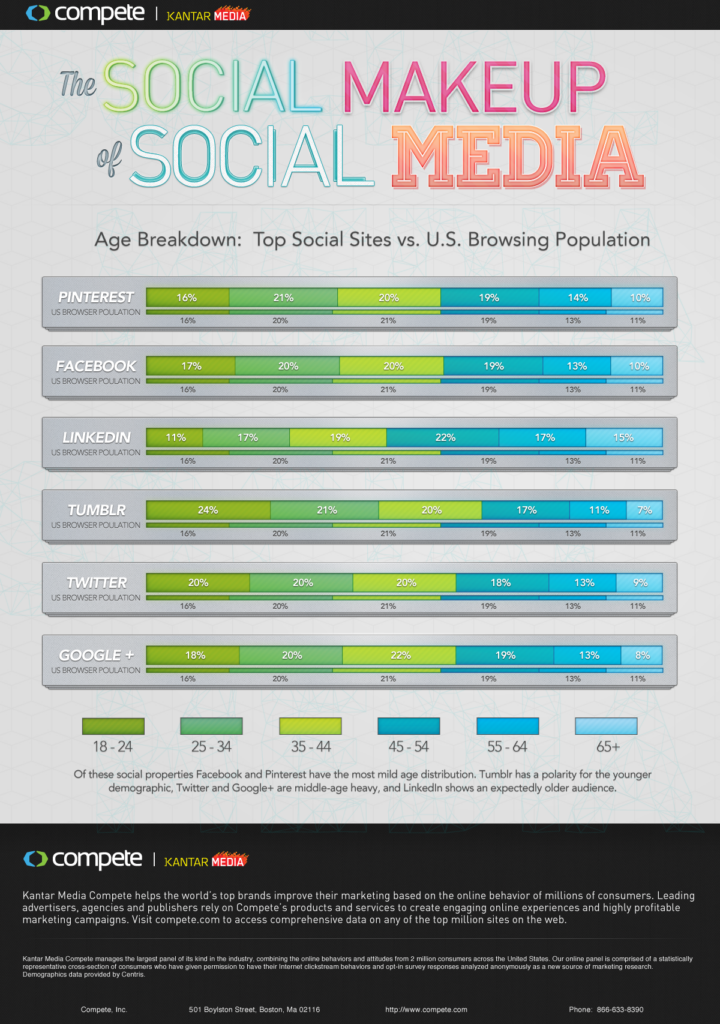
This infographic by Compete illustrates the age breakdown of the top social media sites.
Read MoreFacebook Privacy Fails [INFOGRAPHIC]
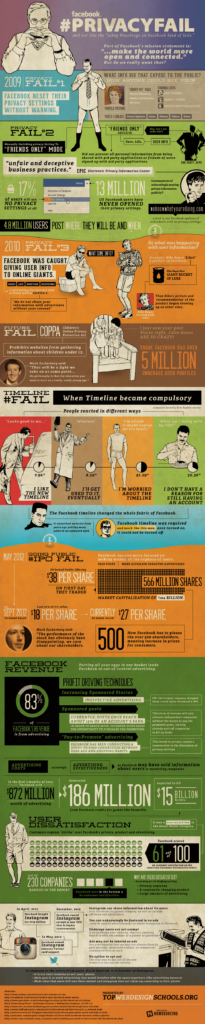
An infographic that lists Facebook’s privacy fumbles.
Read MoreTime Spent Online By Activity & Device, 2012 [CHART]
Social media captures 31% of smartphone internet time, compared to 18% of PC internet time.
Read MoreTime Spent Online By Device, 2011 vs 2012 [CHART]
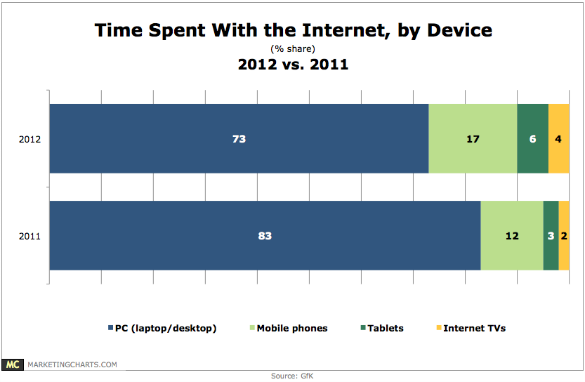
While desktop and laptop computers accounted for 83% of total time spent online last year, that dropped by 10% points to 73% this year.
Read More