Posts by derickson
US Twitter Net Ad Revenues, 2011-2015 [CHART]
As of 2012, eMarketer estimates, 52% of Twitter’s net US ad revenues were from mobile; by 2015, the share will approach two-thirds.
Read MoreUS Facebook Net Ad Revenues, 2011-2015 [CHART]
eMarketer estimates that after less than a full year selling mobile ads, 18% of US net Facebook ad revenues came from mobile in 2012.
Read More
US Digital Ad Spending By Channel, 2011-2017 [CHART]
Desktop ad spending will peak in 2014 at $35.39 billion, up from this year’s projected total of $34.29 billion.
Read MoreAmerican Sports Content Consumption [INFOGRAPHIC]
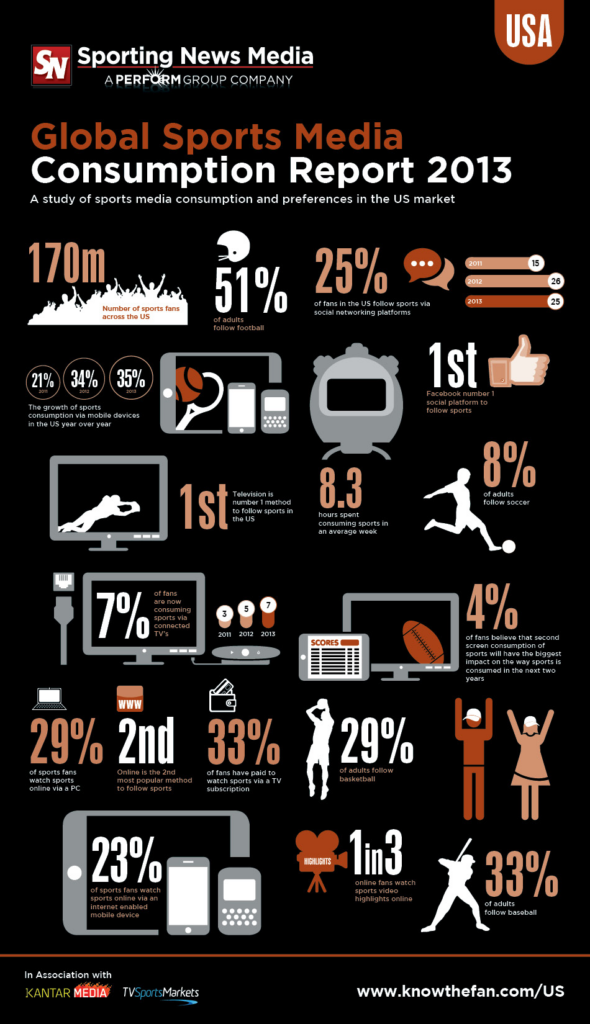
25% of sports fans use social media to follow leagues, teams and players online.
Read MoreQR Code Use Examples & Case Studies [WEBCAST]

David Erickson presents 27 examples and case studies of the good, the bad and the ugly of QR code uses for marketing in this hour-long webcast.
Read MoreAffluent Shoppers' Preferred Purchase Channels By Demographic, April 2013 [CHART]
The store still won out as the most common place to make a purchase among affluent consumers, cited by 78% of respondents.
Read MoremCommerce Activities Of Affluent Americans By Device, April 2013 [TABLE]
Among US internet users ages 21 and older earning more than $150,000, more than eight in 10 owned a smart phone, while 56% reported owning a tablet.
Read MoreWhere Americans Watch TV By Device, January 2013 [TABLE]
While smart mobile device users can now watch TV from anywhere, they still favor sitting at home to watch their shows.
Read MoreTime Americans Spend Watching Mobile TV By Device, January 2013 [CHART]
Only 2% of total TV viewership by American broadband subscribers who watched at least five hours of TV per week occurred on a tablet or smart phone.
Read More