Posts by derickson
US Social Ad Revenues – Desktop vs Mobile, 2013-2018 [CHART]
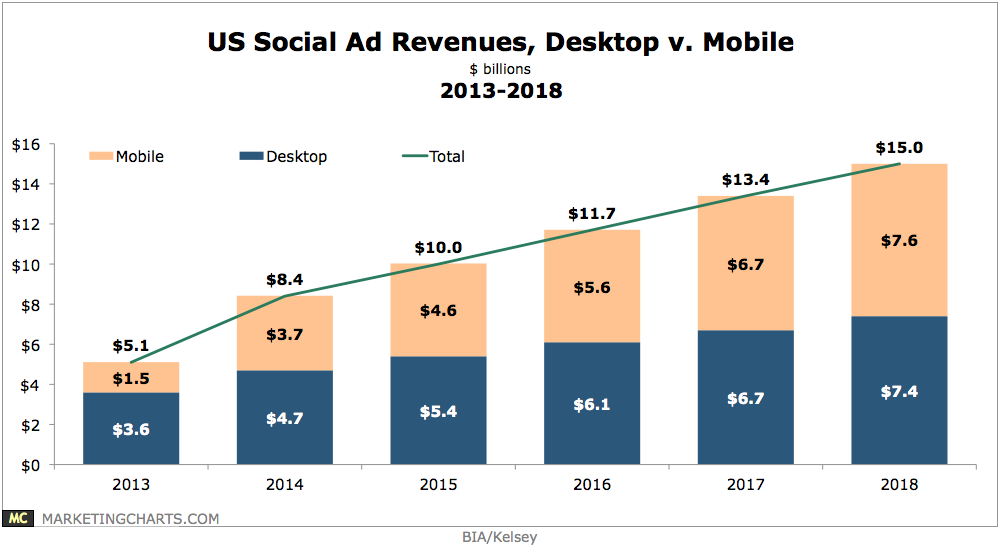
Social mobile ad revenues in the US exceeded $1.5 billion last year, and will grow at a rapid 38.3% compound annual rate through 2018, when they will reach $7.6 billion.
Read MoreUS Social Ad Revenues – Display vs Native, 2013-2018 [CHART]
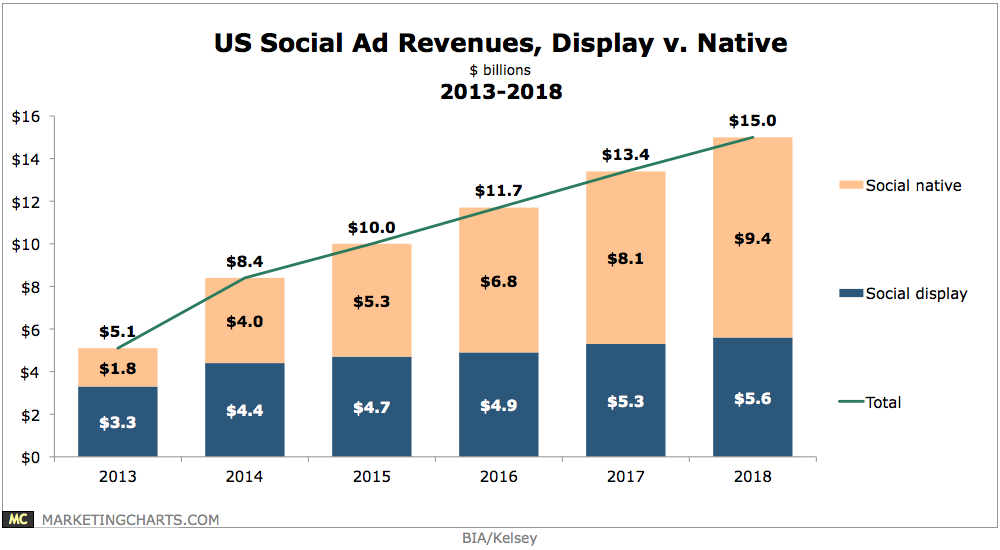
Native social ads are expected to overtake social display ads in revenue next year.
Read MoreTop Mobile Marketing Metrics, May 2014 [CHART]
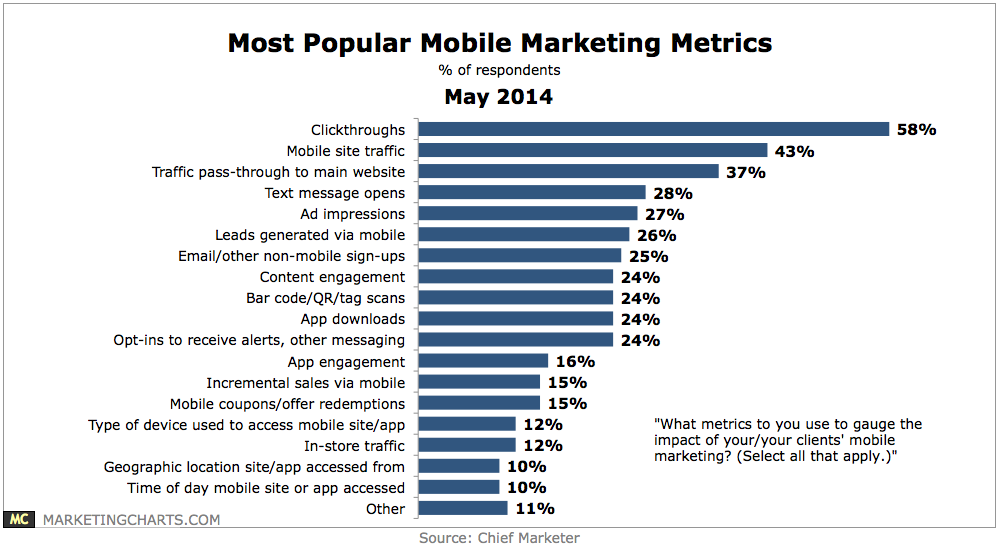
While only 31% of marketers and agencies ran campaigns or promotions directed at mobile users last year, a slight majority 52% plan to run campaigns specific to mobile users this year.
Read MoreUS Desktop Retail eCommerce Spending Growth, Q1 2010 – Q1 2014 [CHART]
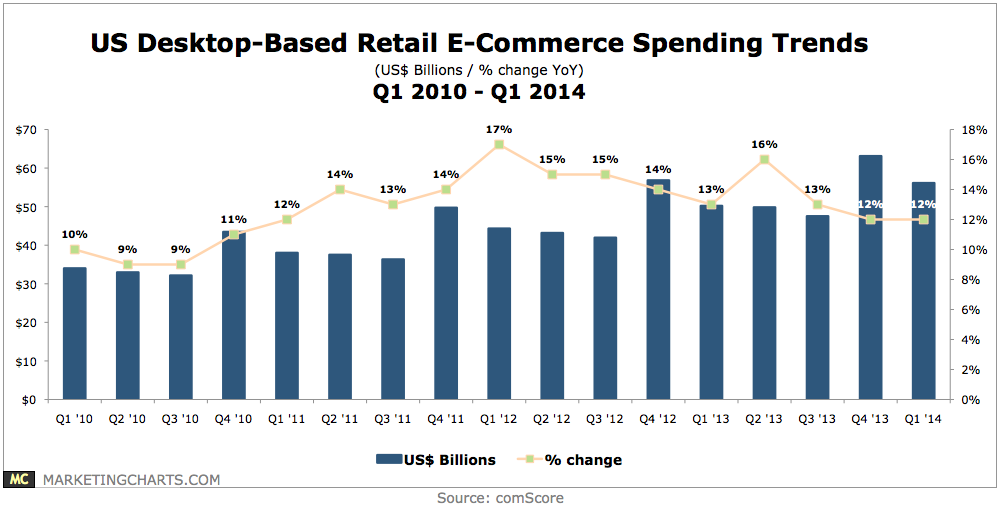
Desktop eCommerce spending increased by 12% year-over-year to $56.1 billion, the 14th consecutive quarter of double-digit growth.
Read MoreUK Social TV Viewers By Demographic, September 2013 [TABLE]
Nearly two-thirds of UK 16- to 24-year-olds who used Twitter said they never live tweeted about TV programs.
Read MoreUK Multitainment Use By Age, February 2014 [CHART]
Social media usage while watching TV was still a minority activity among older teens and early 20-somethings in the UK.
Read MoreUnderstanding & Use Of Programmatic Buying Among Marketers, March 2014 [CHART]
Nearly one-quarter of US client-side marketers understood programmatic buying and had run campaigns on this basis.
Read MoreUS Premium Programmatic Ad Spending By Channel, 2013-2017 [TABLE]
Spending on premium programmatic online display advertising will rise 165.4% in the US this year.
Read MoreConsumers' Attitudes Toward Brand Loyalty, May 2014 [TABLE]
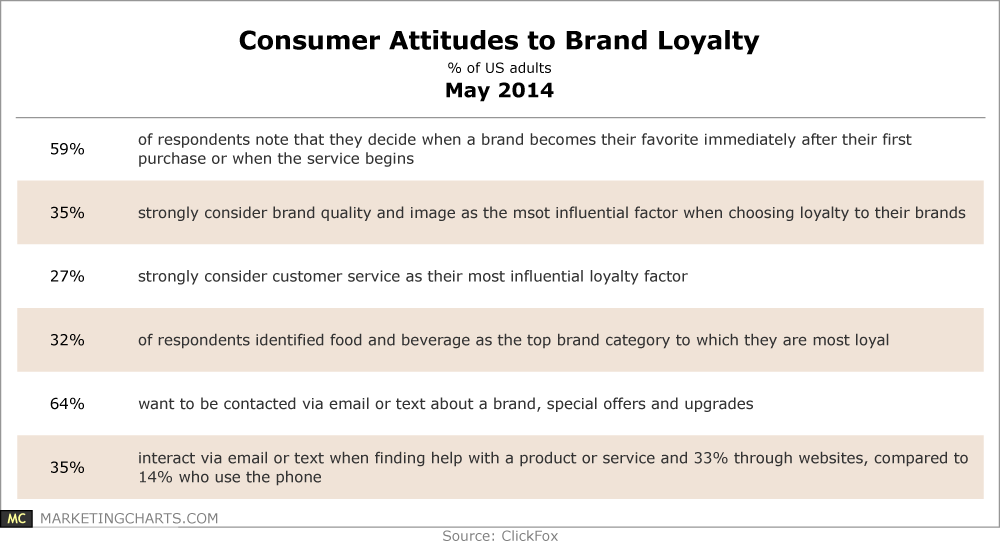
Some 59% of consumers say their decision of when a brand becomes a favorite of theirs occurs right after their first purchase or when their service begins.
Read MoreResponsive Design In Email Marketing, Q1 2014 [CHART]
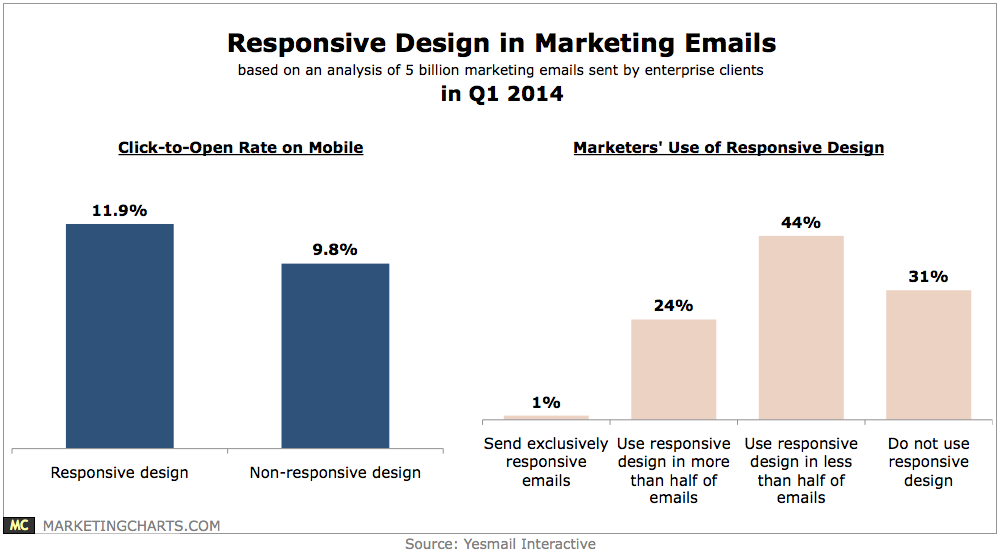
A majority 52% of email opens occurred on a mobile device in Q1.
Read More