Posts Tagged ‘Video Metrics’
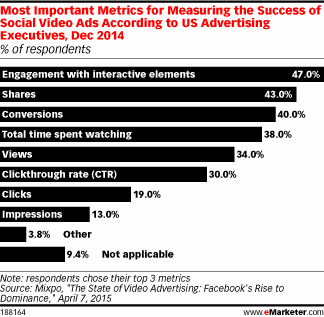
Top Social Video Ad Metrics, December 2014 [CHART]
Mixpo noted that respondents were looking for more than just a social video view or time spent with an ad; they wanted users to take additional steps after seeing the placements.
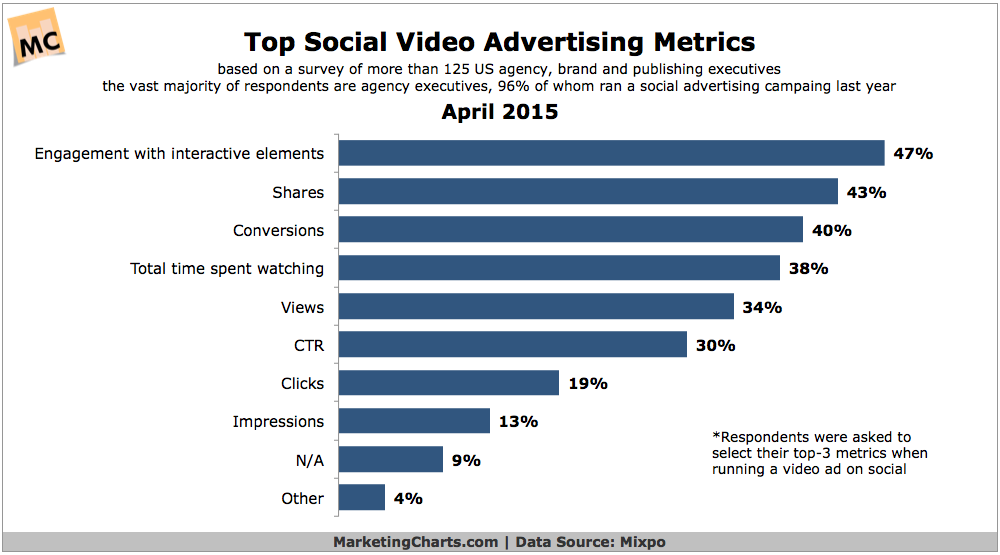
Read MoreSocial Video Advertising Metrics, April 2015 [CHART]
Advertisers running video ads on social media are more interested in metrics such as engagement with interactive elements and shares than they are with views.
Read MoreUS Online Video Completion Rates By Device, Q2 2014 [CHART]
Few videos were watched to full completion during Q2, reports Adobe.
Read MoreUse Of Advanced Video Metrics, Q1 vs Q2 2014 [CHART]
Among those advertisers using a form of advanced measurement during Q2, some 28% requested a cross-screen analysis.
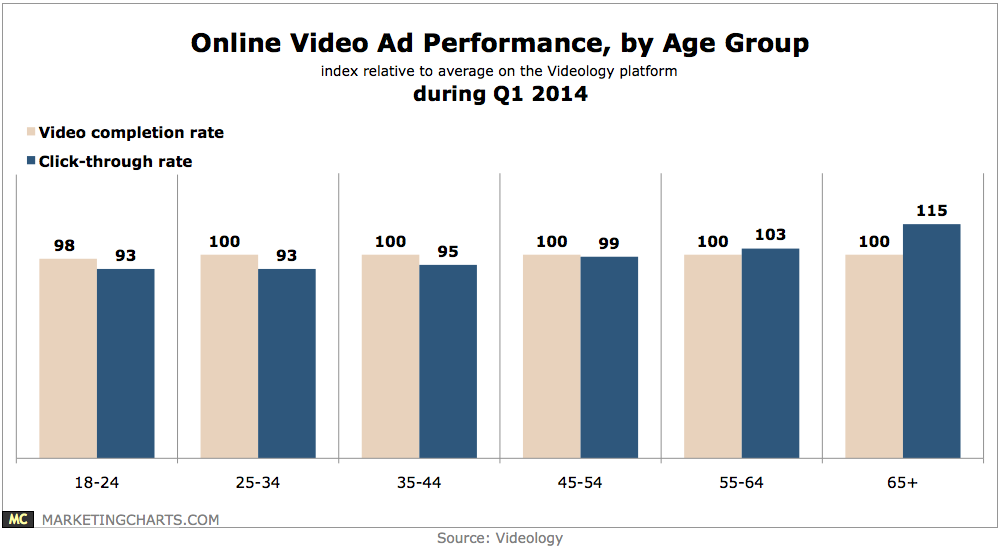
Read MoreOnline Video Ad Performance By Age, Q1 2014 [CHART]
Older viewers were more likely to click on video ads than their younger counterparts in Q1.
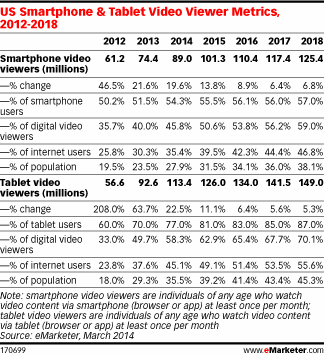
Read MoreUS Mobile Video Viewer Metrics, 2012-2018 [TABLE]
Nearly half of the US population will use a tablet at least monthly in 2014.
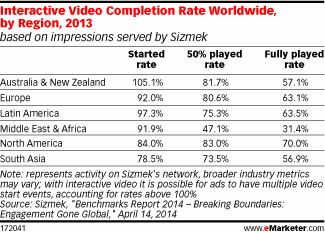
Read MoreInteractive Video Completion Rates Worldwide By Region, 2013 [TABLE]
While clickthrough rates for such ads in 2013 were much lower than those for HTML5 polite video and in-stream video, at 0.17%, 0.39% and 0.60%, respectively, interactive videos did just what they set out to do: Engage those who did view them.
Read MoreGrowth In TV-Related Queries On Google & YouTube, 2012 vs 2013 [CHART]
TV-related searches on YouTube were up 54% during May-December 2013 over the comparable year-earlier period.
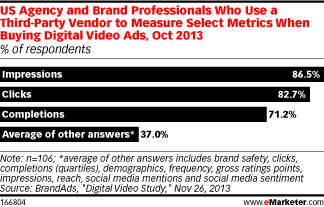
Read MoreVideo Ad Metrics, October 2013 [CHART]
The three metrics most used among agency and brand professionals when buying digital video ads were impressions, clicks and completions.
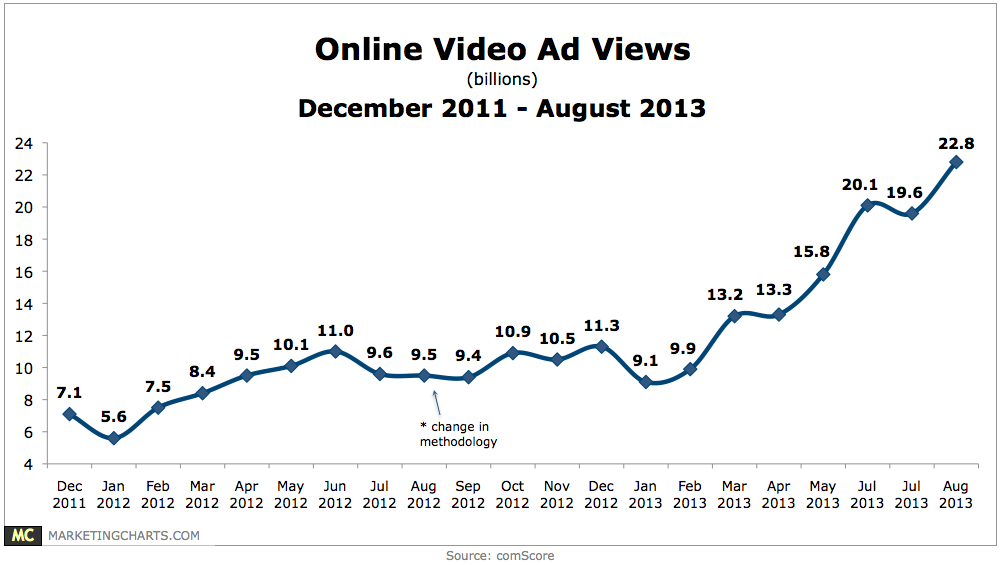
Read MoreOnline Video Ad Views, December 2011 – August 2013 [CHART]
Online video ad views have been increasing rapidly this year, reaching a new high of 22.8 billion in August after a slight dip in July.
Read More