Posts Tagged ‘Travel Marketing’
How Americans Celebrate Independence Day [INFOGRAPHIC]
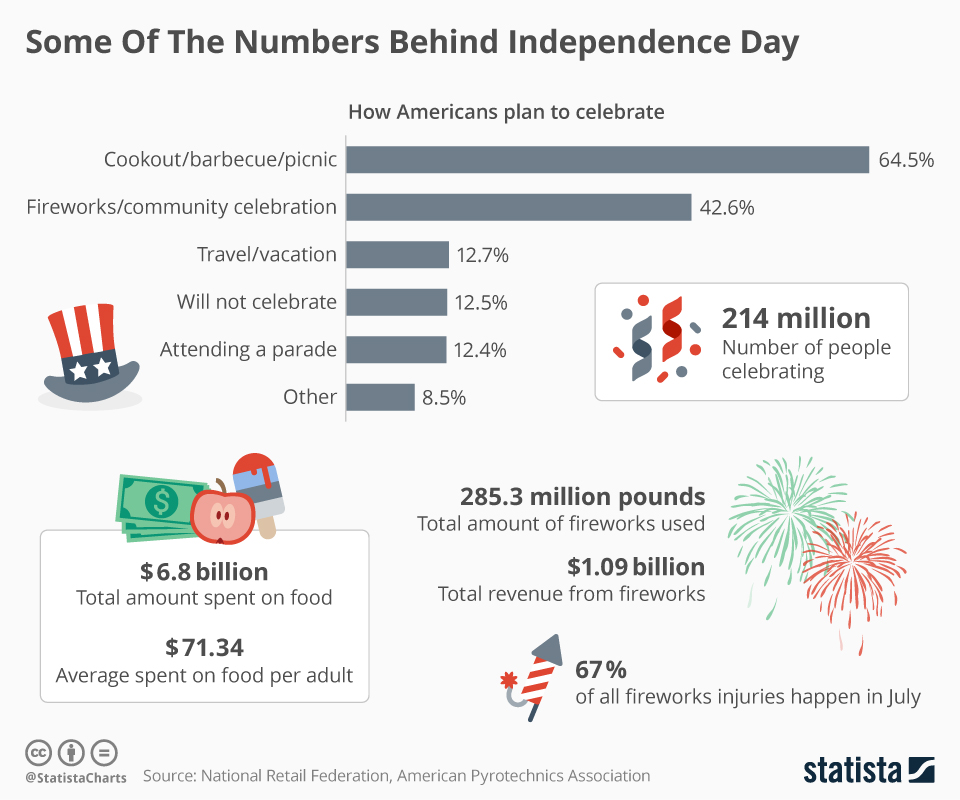
This infographic illustrates how Americans celebrate Independence Day, from eating to travel to entertainment.
Read MoreGoogle AdWords Benchmark Metrics By Industry [CHART]
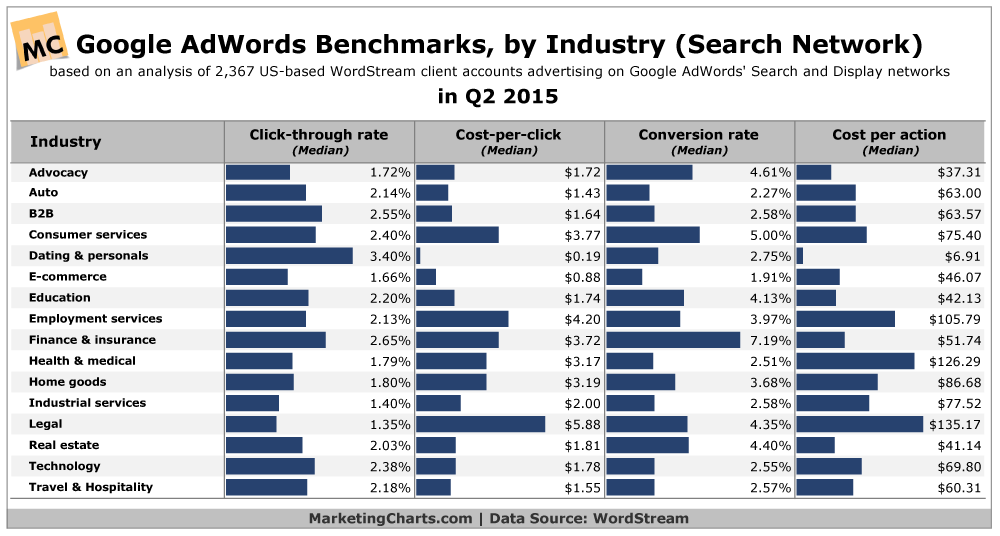
The median click-through rate (CTR) in AdWords across industries is 1.91% on the search network.
Read MoreElements Of Successful Email Campaigns [INFOGRAPHIC]
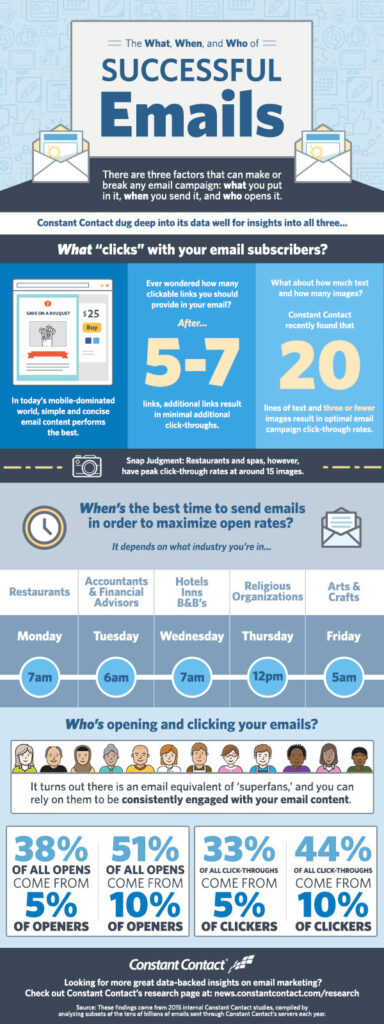
This infographic highlights research from email marketing service provider Constant Contact illustrating the elements of successful email campaigns.
Read MoreInternet Of Things Spending By Industry [TABLE]
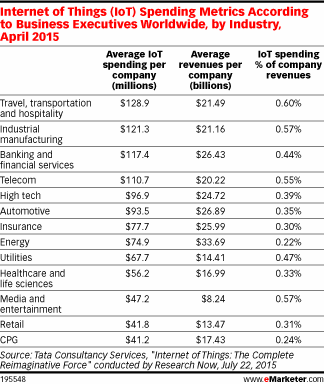
The travel and hospitality industry leads spending on the Internet of Things technology.
Read MoreShare Of Email Clicks By Industry & Device
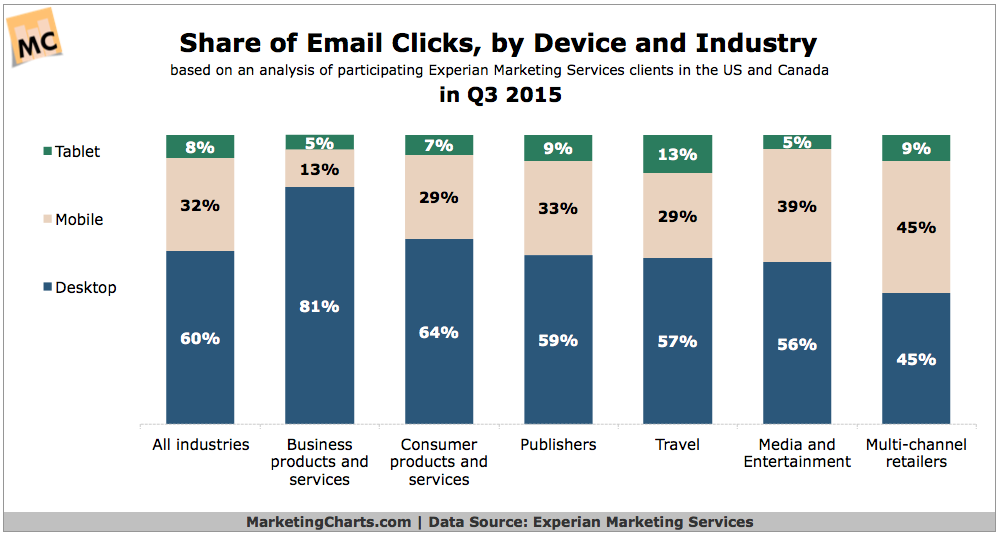
Brands continue to increase their email volume, registering a 24.8% year-over-year rise in Q3.
Read MoreGlobal Email Deliverability Rates By Industry, October 2015 [CHART]
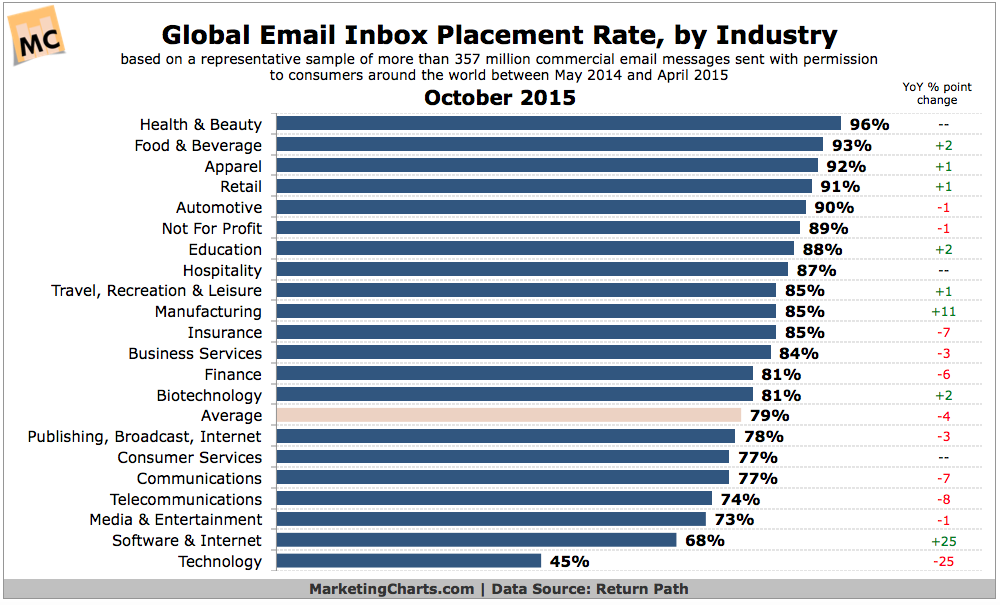
Some 21% of permission emails from legitimate senders around the world failed to reach the inbox during the year-long period from May 2014 to April 2015.
Read MoreMarketing Email Click Share By Industry, Q2 2015 [TABLE]
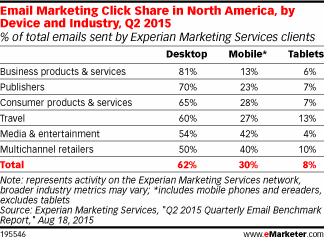
On average, 62% of clicks happened on the desktop—14 percentage points ahead of the desktop share of opens.
Read MoreMarketing Email Open Share By Industry, Q2 2015 [TABLE]
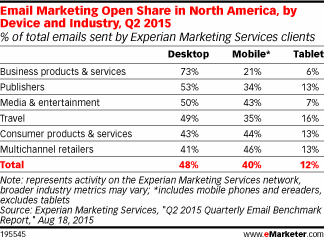
Overall, 48% of all marketing emails sent by Experian clients were opened on the desktop,
Read MoreSocial Amplification Rate Of US Influencers By Industry, H1 2015 [CHART]
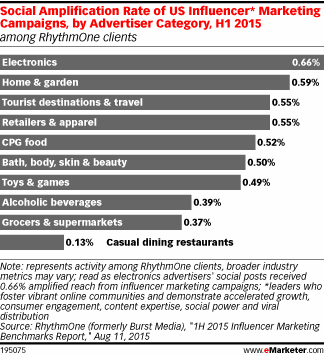
Social amplification rates of US influencers were highest in the electronics category, at 0.66%.
Read MoreSocial Engagement Rate For US Influencers By Industry, H1 2015 [CHART]
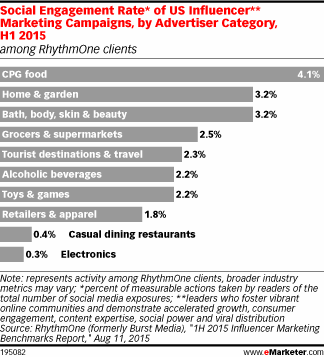
The Social engagement rate for US influencers averaged 3.4% in H1 2015.
Read More