Posts Tagged ‘Travel Marketing’
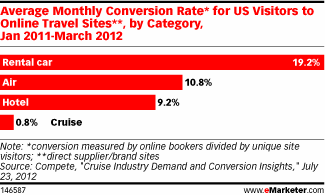
Conversion Rates For American Visitors To Travel Websites By Category, January 2011 – March 2012 [CHART]
The monthly average for conversions via cruise sites was less than 1% between January 2011 and March 2012.
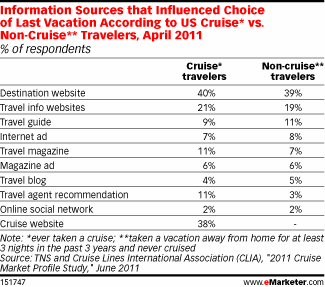
Read MoreSources That Influence Vacation Choice For US Cruise vs. Non-Cruise Travelers, April 2011 [TABLE]
While many cruisers turn to travel agents to book, only 11% considered agent recommendations as a purchase influence.
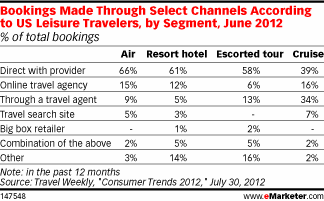
Read MoreChannels Through Which American Travelers Book Their Trips By Segment, June 2012 [TABLE]
34% of cruise bookings were made through travel agents in the 12-month span ending June 2012.
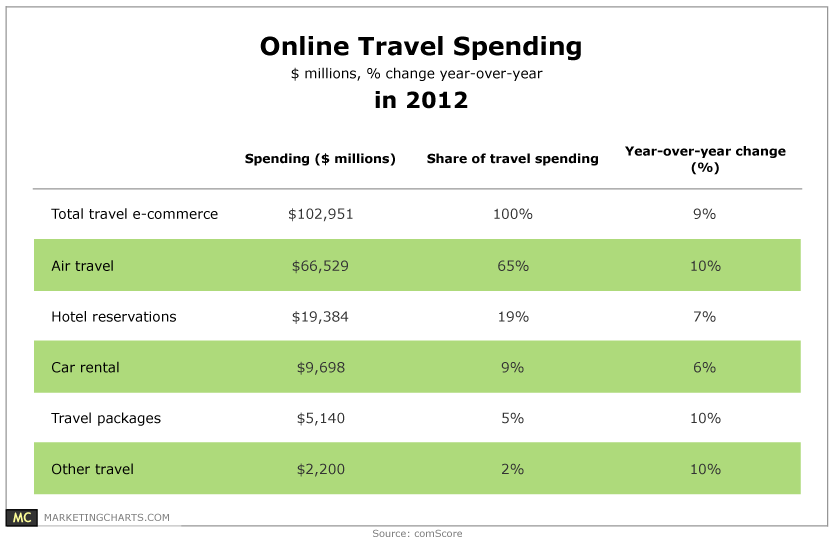
Read MoreOnline Travel Spending, 2012 [TABLE]
US travel e-commerce sales exceeded $100 billion for the first time last year, reaching $103 billion.
Read MoreThe Economic Impact Of Mapping [INFOGRAPHIC]
Google put together this infographic to illustrate some examples of the benefits of maps.
Read MoreUS Location-Based Mobile Ads By Industry, 2012 [CHART]
100% of the studied mobile campaigns in the grocery, political, health care, lottery, real estate and education industries used location info of some sort.
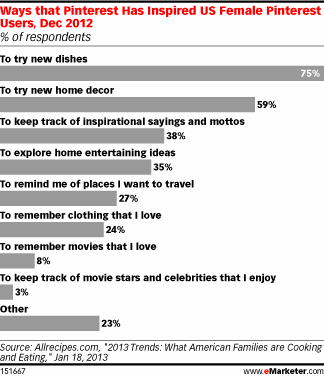
Read MoreTop Ways Pinterest Inspires American Women, December 2012 [CHART]
Thirty percent of those surveyed from the entire Allrecipe.com and Meredith pool reported using Pinterest at least once a week.
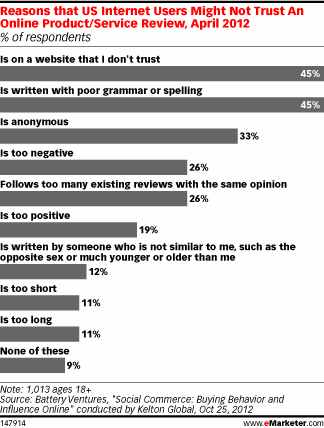
Read MoreTop Reasons For Consumers To Distrust Online Reviews, April 2012 [CHART]
Poor grammar and spelling were as suspect as a website that seemed untrustworthy in itself.
Read MoreHow Online Customer Reviews Affect Perceptions Of Local Businesses, 2010 & 2012 [CHART]
28% said they trusted reviews if there were multiple reviews; 24% said they trusted the reviews if they believed them to be authentic; and 20% said they trusted reviews for some types of businesses but not others.
Read More