Posts Tagged ‘Travel Marketing’
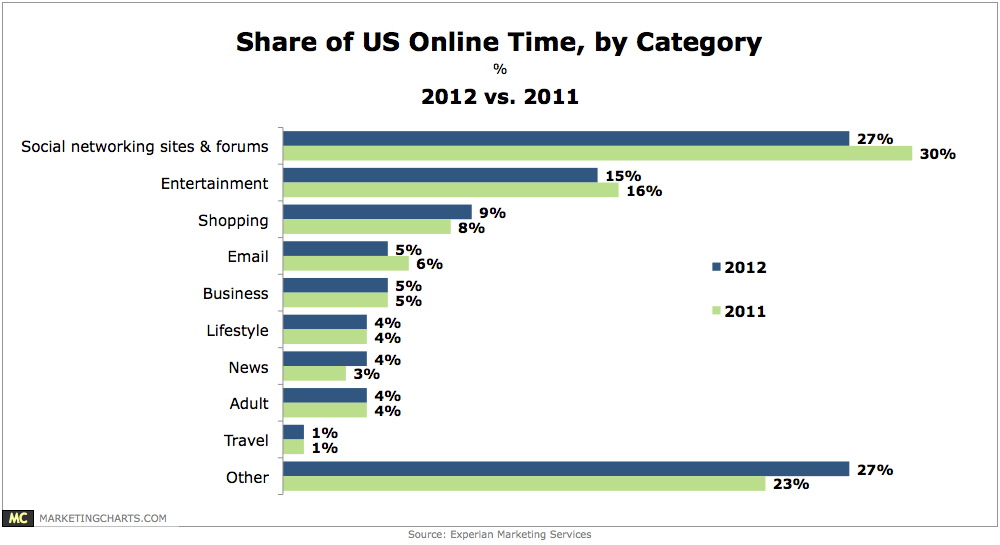
Time Spent Online By Activity, 2011 & 2012 [TABLE]
On the desktop internet, activity was much more heavily weighted toward social networking, which accounted for 27% of time spent online.
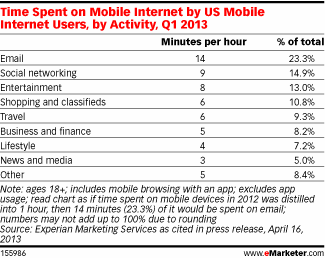
Read MoreTime Spent On Mobile Device Online By Activity, Q1 2013 [TABLE]
US mobile internet users spent the greatest percentage of their mobile web time using email, a 23% share of time spent vs. only 5% of time spent on desktop.
Read MoreShare Of Americans' Time Online By Category, 2011 vs 2012 [CHART]
27% of Americans’ time spent online last year was spent accessing social networking sites and forums.
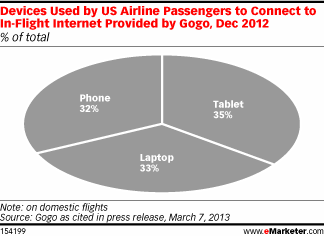
Read MoreDevices Used To Connect To In-Flight Internet, December 2012 [CHART]
According to TripAdvisor’s annual air travel study, 37% of travelers considered their tablet an “essential” in-flight accessory—a 5% increase from the 2012 survey.
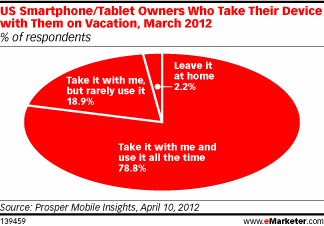
Read MoreAmericans' Use Of Mobile Devices On Vacation, March 2012 [CHART]
Approximately 98% took their mobile devices with them on vacation; nearly four in five respondents in this group used them “all the time.”
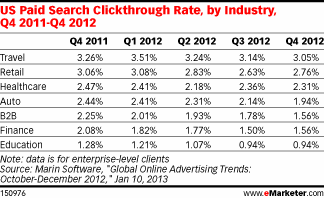
Read MoreUS Search Advertising Click-Through Rates By Industry, Q4 2011-Q4 2012 [TABLE]
Only 20% of new-car shoppers in the US buy the brand they first searched for, according to Google data.
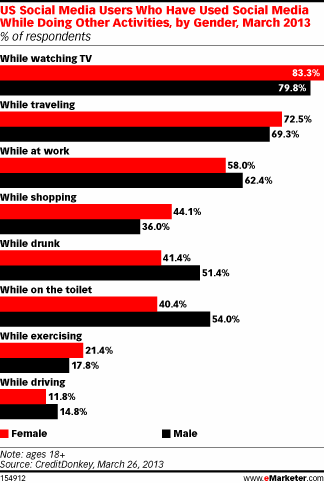
Read MoreMultiscreen Behavior With Facebook & Twitter By Gender, March 2013 [CHART]
Women were slightly more likely than men to turn to social media while watching TV, traveling and exercising, and significantly more likely to do so while shopping.
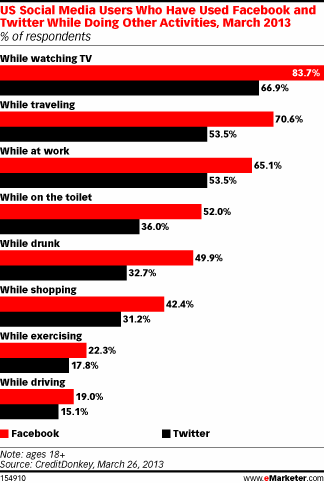
Read MoreMultiscreen Behavior With Facebook & Twitter, March 2013 [CHART]
More than eight in 10 Facebook users and about two-thirds of Twitter users used social networks while channel surfing.
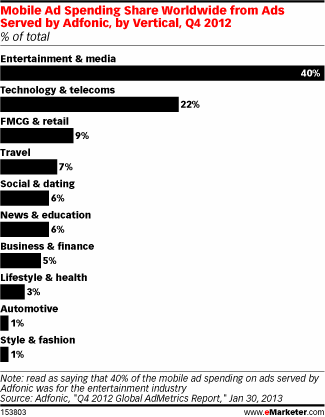
Read MoreGlobal Mobile Ad Spending Share By Vertical, Q4 2012 [CHART]
The worst performers on tablets vs. smart phones were the fast-moving consumer goods and retail industry, along with the social and dating category.
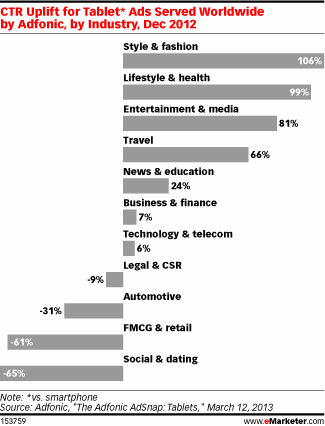
Read MoreTablet Ad Click-Through Rate Uplift By Industry, December 2012 [CHART]
Click-through rates for entertainment and media, as well as the travel category rose by 81% and 66%, respectively.
Read More