Posts Tagged ‘Travel Marketing’
Facebook Ad Performance By Industry, Q1 2013 [CHART]
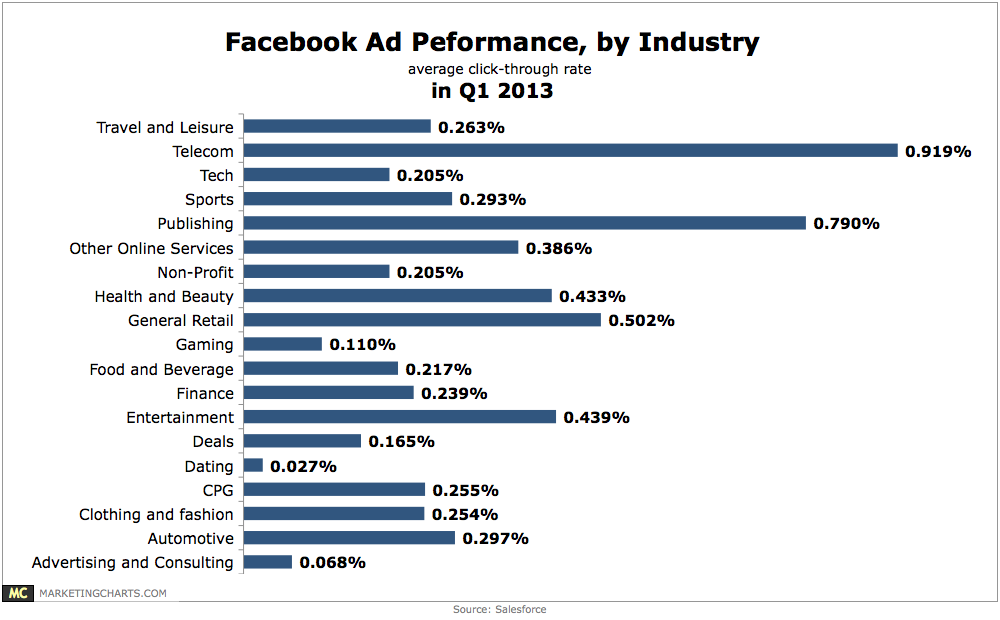
Telecom (0.919%) and publishing (0.79%) brands are leading the charge in Facebook click-through rates.
Read MoreTablet vs. Smart Phone Website Visits For Select Industries, January 2013 [CHART]
Travel not only had the highest percentage of internet traffic coming from tablets at 11.2%, but it was also the only industry studied that actually saw more tablet traffic than smart phone traffic.
Read MoreAverage Global Hotel Website Pageviews/Visit by Device, Q4 2012 [CHART]
Tablet users spent much more time on hotel websites, viewing an average of 4.9 pages per visit in Q4 2012, approximately the same as PC users.
Read MoreGlobal Hotel Website Visits By Device, Q4 2012 [CHART]
Google predicted that US hotel searches would be up 24% in 2013 overall, but that includes a 68% uptick in searches from mobile devices against a 4% decrease in desktop queries.
Read MoreFirst Person Point Of View Home Movies: Disneyland Through Google Glass [VIDEO]

Joe’s Daily compiled video clips taken via Google Glass during a vacation to Disneyland in California: One aspect of Glass that will have mass consumer appeal.
Read MoreFacebook Ad Performance By Industry, Q1 2013 [CHART]

Telecom (0.919%) and publishing (0.79%) brands are leading the charge in click-through rates.
Read MoreMost Popular Types Of Loyalty Programs, December 2012 [CHART]
US internet users on average participated in 7.4 loyalty programs last year.
Read MoreWhere Americans Watch TV By Device, January 2013 [TABLE]
While smart mobile device users can now watch TV from anywhere, they still favor sitting at home to watch their shows.
Read MoreEmail Volume Variance By Industry, Q1 2013 [CHART]
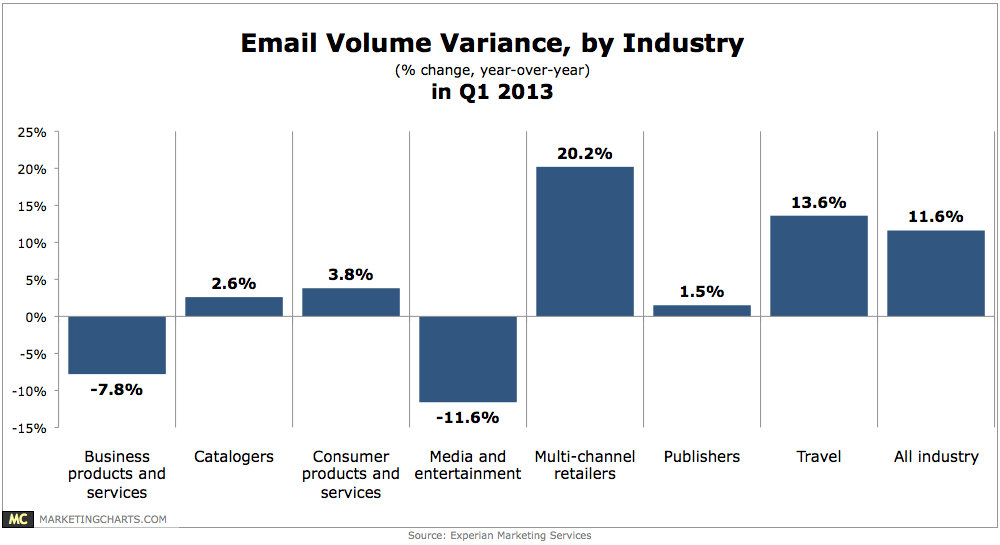
Email volume increased by 11.6% year-over-year in Q1, following a 5.4% year-over-year increase in Q4.
Read MoreProducts Researched & Purchased On A Tablet, March 2012 [TABLE]
A survey from the Online Publishers Association compared product research with product purchase by category among tablet users in March 2013.
Read More