Posts Tagged ‘Travel Marketing’
Devices Used To Research & Purchase Travel, March 2013 [CHART]
40% of digital travel researchers will plan trips via tablets and smartphones in 2013.
Read MoreWebsites Used To Read Traveler Online Reviews, 2012 [CHART]
In 2012, approximately two in five US travelers used online travel agencies, general search engines and travel-specific review sites during their planning process.
Read MoreHospitality Industry Online Reviewers, January 2013 [CHART]
More than half of the 15,000 TripBarometer participants said they’d written a review for an accommodation after staying there.
Read MoreTraveler Review Websites By Number Of Reviews, June 2013 [TABLE]
The number of reviews on TripAdvisor surpassed 100 million in March 2013, bolstered by a 50% increase year over year.
Read MoreProducts LGBT Smart Phone Users Have Purchased On Mobile Device, May 2013 [TABLE]
15% of LGBT smartphone owners and the same percentage of tablet owners purchased hotels via their respective devices in the preceding three months.
Read MoreUS LGBT Mobile Travel Planners, May 2013 [TABLE]
Smart phone penetration among gay and lesbian web users reached record heights in 2012, at 91% and 82%, respectively.
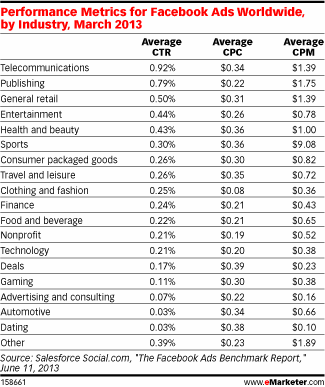
Read MoreGlobal Facebook Advertising Performance Metrics By Industry, March 2013 [TABLE]
For overall Facebook ads served by industry, sports cost by far and away the most, at a CPM of $9.08.
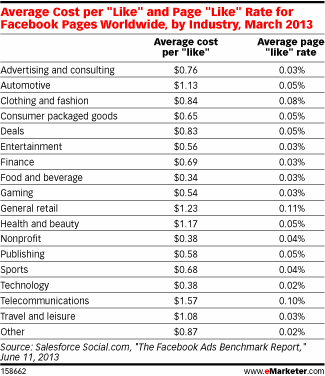
Read MoreGlobal Facebook Cost Per Like By Industry, March 2013 [TABLE]
General retail and telecommunications had the most success generating page “likes,” at a rate of 0.11% and 0.10%, respectively.
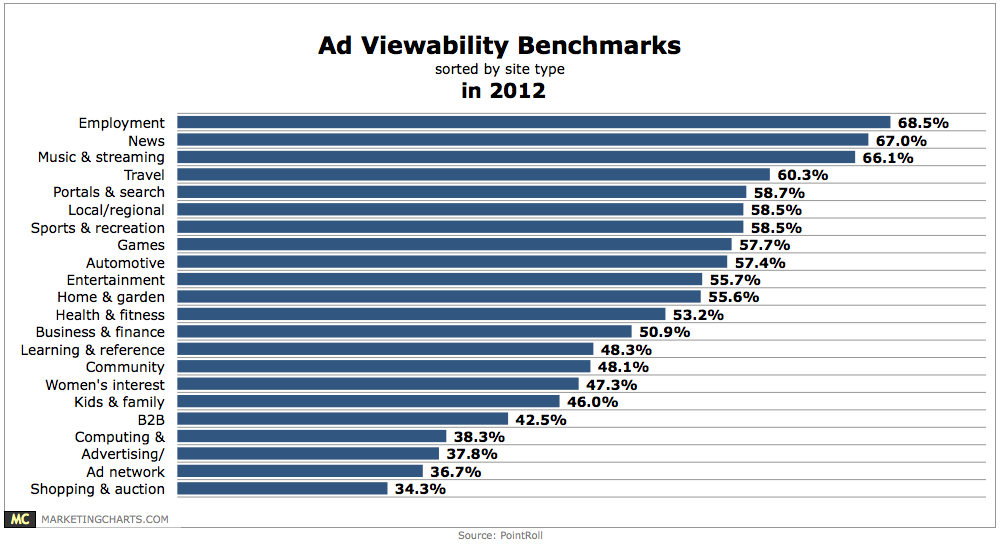
Read MoreAd Viewability Benchmarks By Site Type, 2012 [CHART]
Covering 2012 activity, the data shows that viewability rates were lowest on shopping and auction (34.3%) and ad network (36.7%) sites, and highest on employment (68.5%), news (67%) and music and streaming media (66.1%) sites.
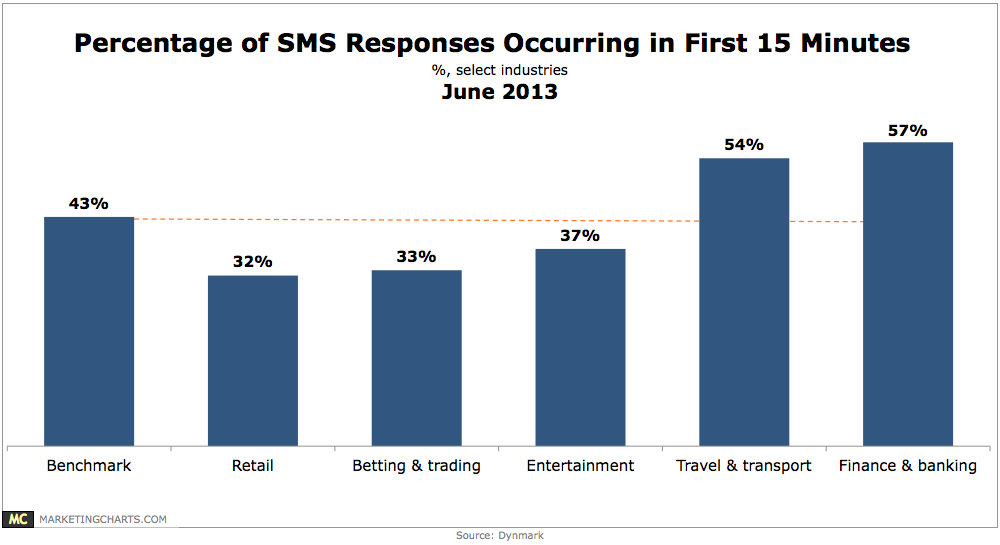
Read MoreImmediate Text Message Marketing Responses By Industry, June 2013 [CHART]
The finance and banking and travel and transport sectors garner quick responses, with 57% and 54% of their responses, respectively, coming in the first 15 minutes.
Read More


