Posts Tagged ‘Travel Marketing’
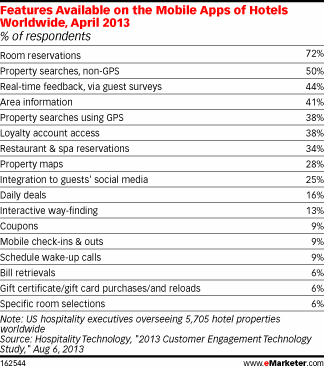
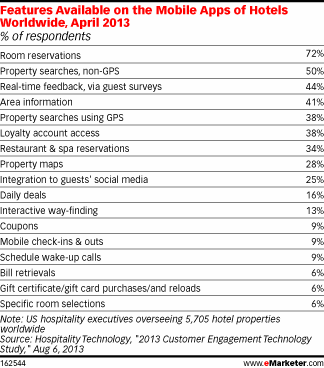
Hotel Mobile App Features, April 2013 [TABLE]
While nearly three-fourths of these apps provided reservations capabilities, most other mobile features were in use by less than half of properties.
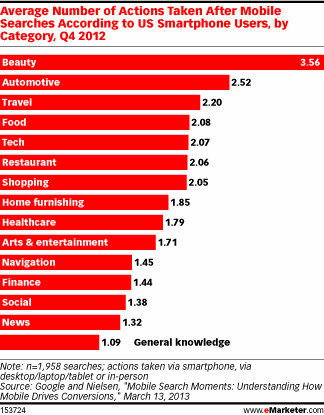
Read MoreAverage Number Of Actions Taken After Mobile Searches By Category, Q4 2012 [CHART]
US smartphone users averaged 2.20 actions after conducting a mobile travel search.
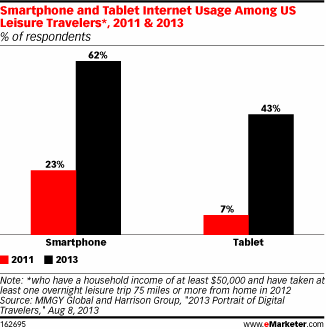
Read MoreMobile Use Among Leisure Travelers, 2011 & 2013 [CHART]
Among US leisure travelers with a household income of at least $50,000 who took a trip at least 75 miles from home in 2012, 62% used smartphones this year, and 43% used tablets.
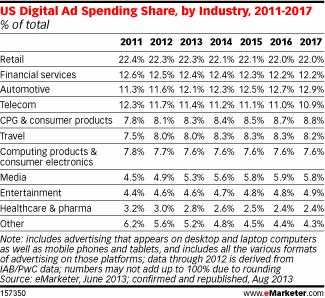
Read MoreUS Online Ad Spending Share By Industry, 2011-2017 [TABLE]
eMarketer expects the retail industry’s share of the total US digital advertising pie to decline slightly, from 22.3% in 2013 to 22.0% in 2017.
Read MoreHotels' Mobile App Features, April 2013 [TABLE]
Making reservations was the most common feature on existing mobile apps employed by hotels, used by 72%.
Read MoreYelp Reviews & Small Businesses [INFOGRAPHIC]
This infographic from Merchant Warehouse illustrates Yelp reviews affect on small businesses.
Read MoreEmail Click-to-Open Rates By Industry, Q2 2012 [CHART]
49% of email opens happen on a mobile device.
Read MoreActive Email Subscriber Rates By Industry, Q2 2013 [CHART]
B2B email databases had a subscriber activity rate of just 1.5% (referring to the percentage who opened an email in the last 90 days).
Read MoreMobile Device Share Of Online Conversions, August 2013 [CHART]
A study of 100 million conversion events across 4 major verticals and multiple devices reveals that 31% of said conversions took place on a mobile device.
Read MoreTravel Search Advertising Click Share By Device, Q1 2012-Q1 2013 [CHART]
Between Q1 2012 and Q1 2013, the majority of US travel and leisure paid search clicks came from PC searches, but the proportion from mobile devices had risen fairly steadily.
Read More