Posts Tagged ‘Travel Marketing’
Global Digital Travel Sales By Country, 2012-2017 [TABLE]
Consumers across the world are becoming more comfortable making purchases on the internet, and digital travel sales are beginning to mature on a global basis.
Read MoreSocial Media Response Rates By Industry, Q3 2013 [TABLE]
A breakdown of social media response times and rates by industry found that government companies had the longest response time—14.5 hours—and a response rate of just 17%.
Read MoreThe Personality Types Of Popular Facebook Pages [INFOGRAPHIC]
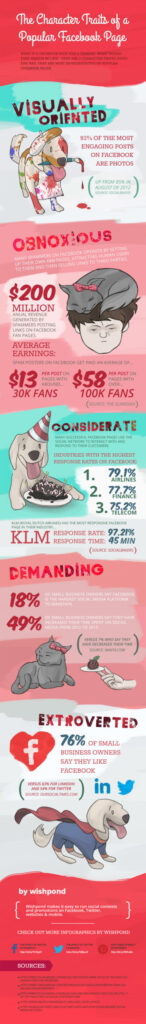
This infographic by Wishpond illustrates popular Facebook pages by personality type.
Read MoreMost Used Mobile Notifications, October 2013 [CHART]
On average, smartphone users had signed up for at least one notification from eight of the 14 categories included in the survey.
Read MoreTop Purchase Influencers By Category & Generation, January 2014 [TABLE]
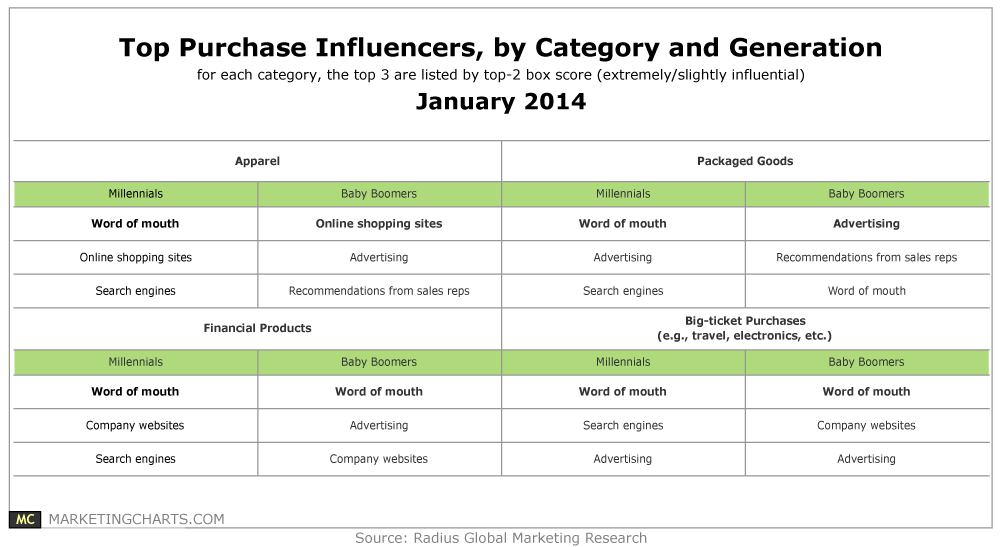
Millennials appear to be more influenced by word-of-mouth than Baby Boomers, while the latter are more reliant on advertising than the younger generation.
Read MoreTop 5 US Real-Time Bidders By Industry, Q2 2013 [CHART]
The automotive industry will increase and extend its investment in programmatic advertising in 2014.
Read MoreReasons US Smart Phone Owners Play Mobile Games By Gender, October 2013 [VIDEO]
Half of US smart phone owners cited stress relief as their reason for playing smart phone games, the No. 1 response.
Read MoreGlobal Online Travel Ad Revenues By Site, 2012 vs 2013 [TABLE]
Travel metasearch sites are influencing the marketplace for digital travel shopping and booking,
Read MoreGlobal Mobile Banner Ad Interaction Rates, 2013 [TABLE]
Mobile expandable banners had greater success in engaging customers than polite banners across almost all verticals.
Read MoreGlobal Mobile Ad Click-Through Rates By Vertical, 2013 [CHART]
Mobile ads in the retail and electronics categories had the highest clickthrough rates (CTRs), at 0.52% and 0.41%, respectively.
Read More